O&M Guide
O&M Guide
Overview
Overview
As a cloud - native backup and disaster recovery platform, HyperBDR covers the entire process from data protection to business orchestration. After delivery, the operation and maintenance team needs to conduct daily inspections of the system, use the monitoring dashboard, carry out regular disaster recovery drills, and perform rapid failover in case of sudden failures.
This manual will provide operation guidelines and best practices for operation and maintenance personnel to ensure stable operation in the production environment and meet the business continuity requirements.
System Architecture
Architecture
The system adopts a modular architecture to enable data collection, transmission, storage, and management from the production site to the target site. It supports various business scenarios such as disaster recovery and migration, and provides unified scheduling and visualized operations & maintenance capabilities. 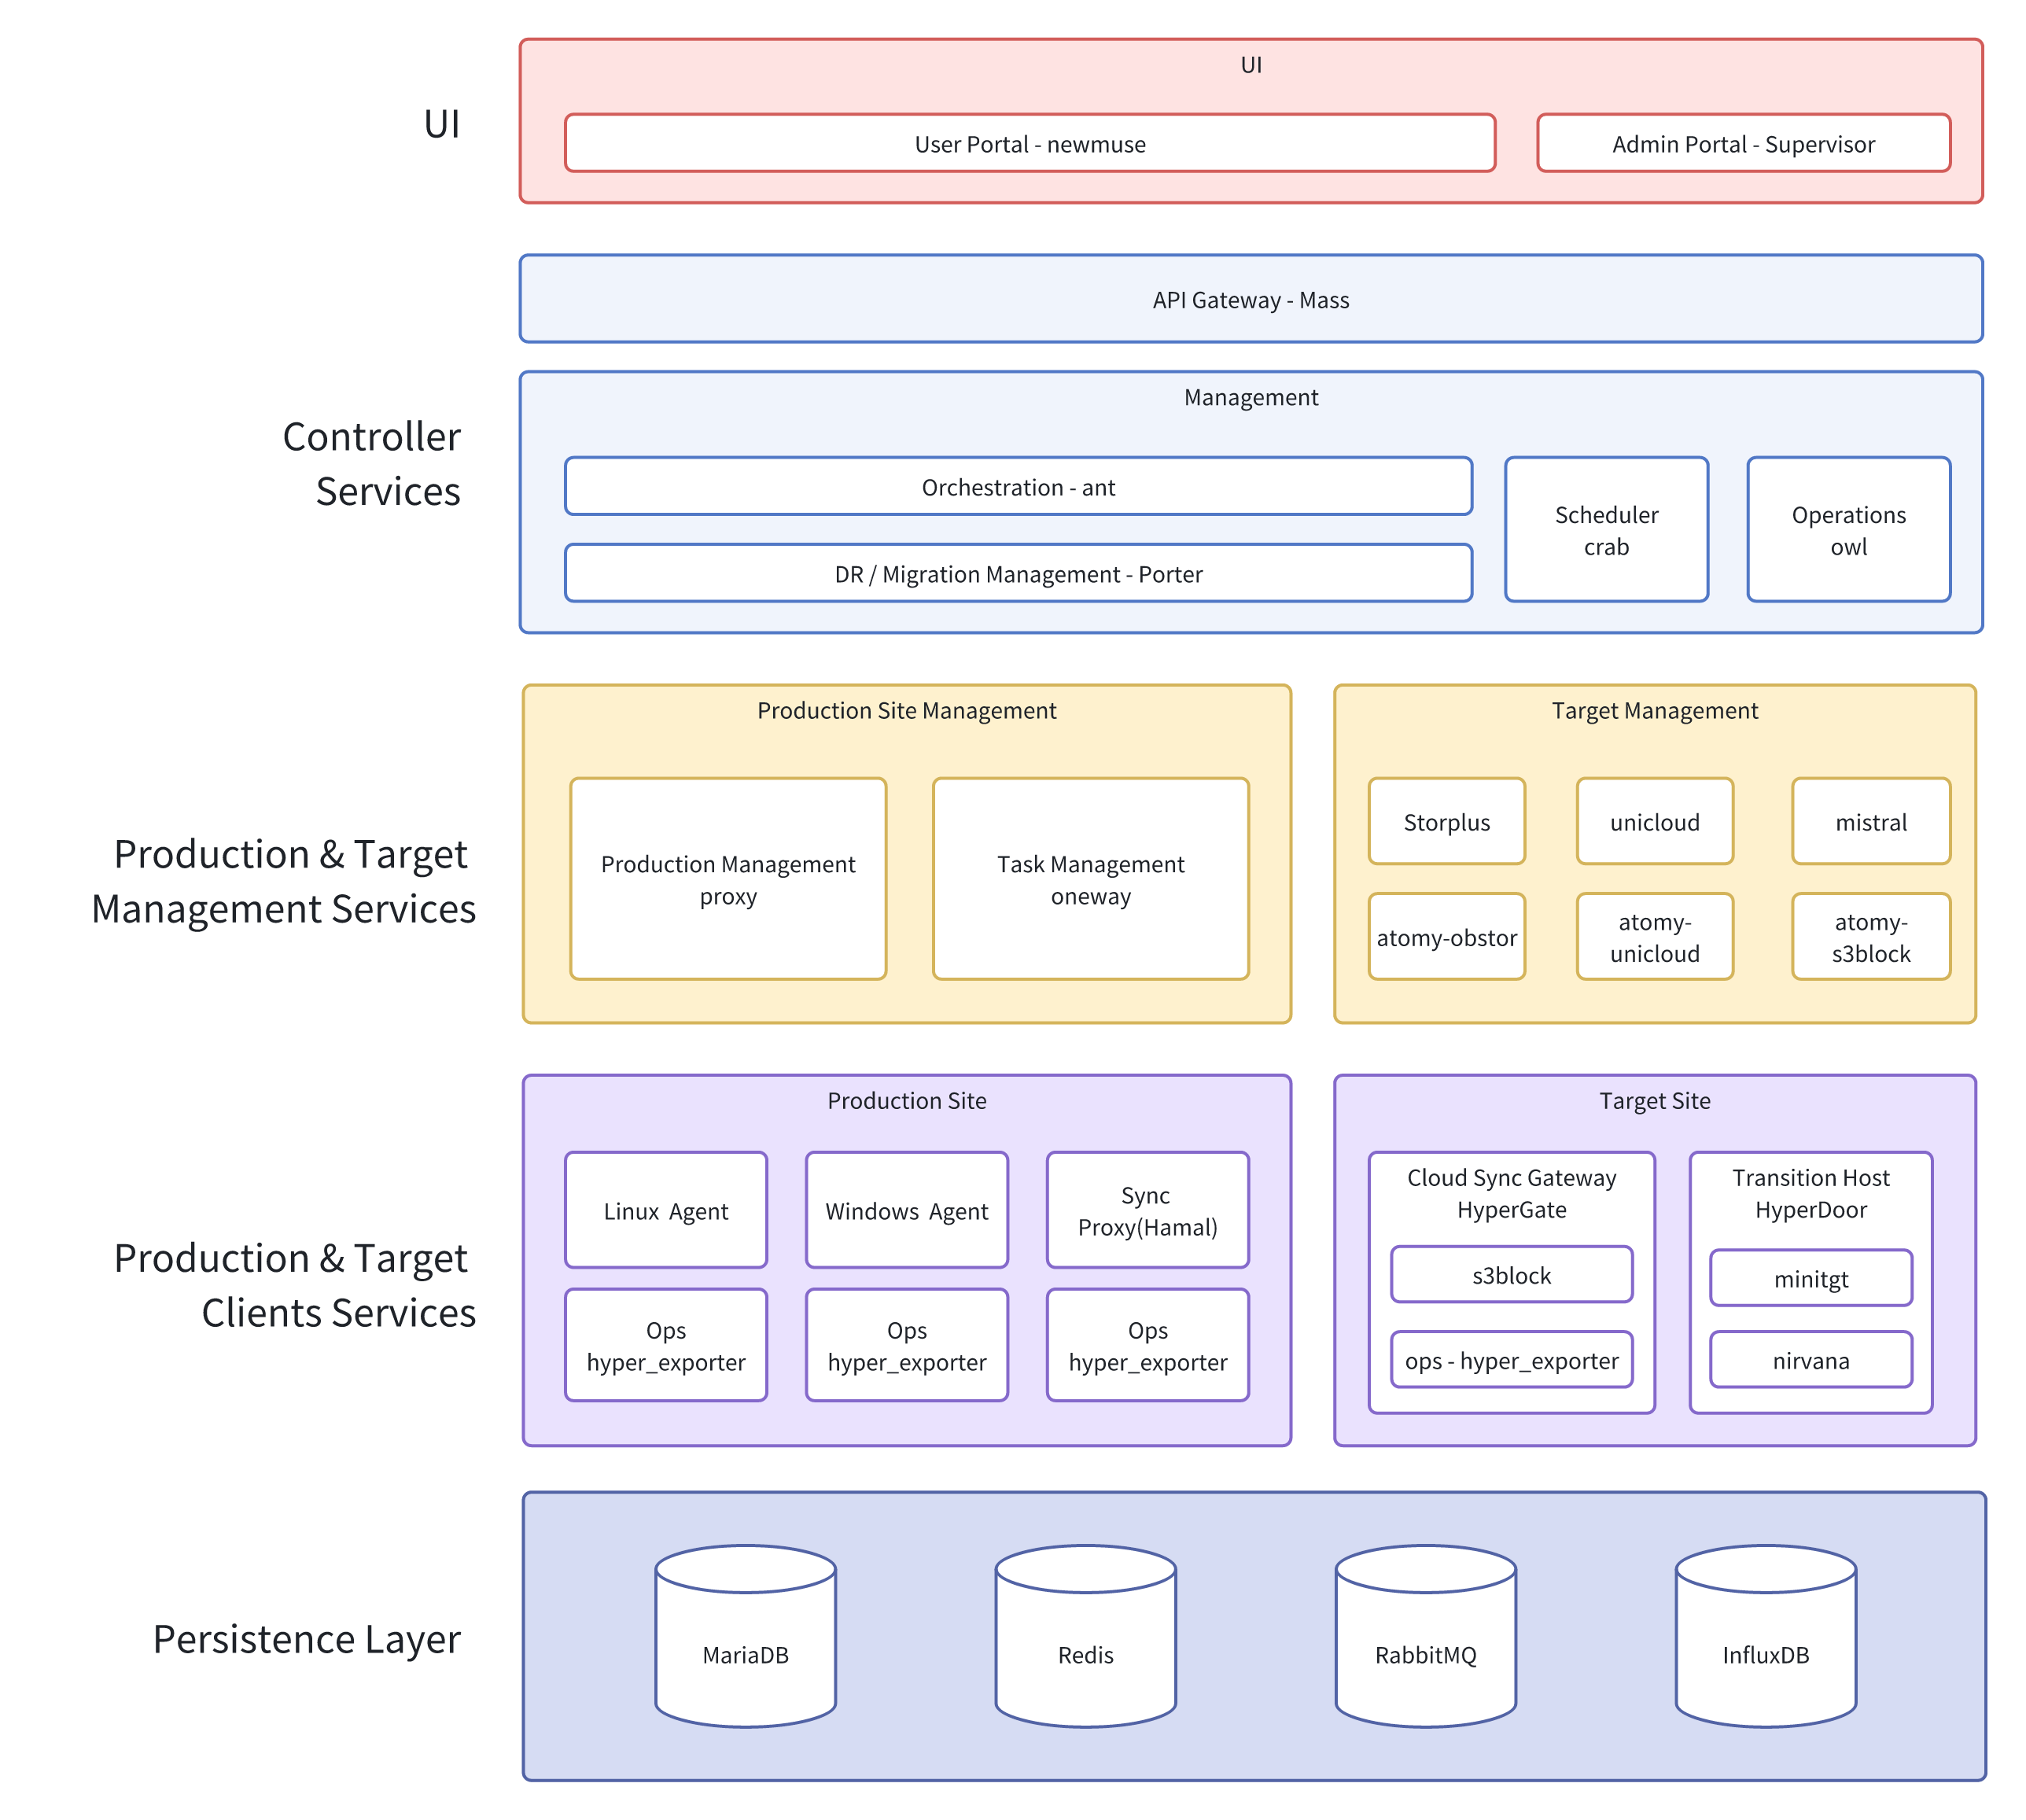
O&M Management
Daliy Operation Maintenance
Routine Checks
System Health Check
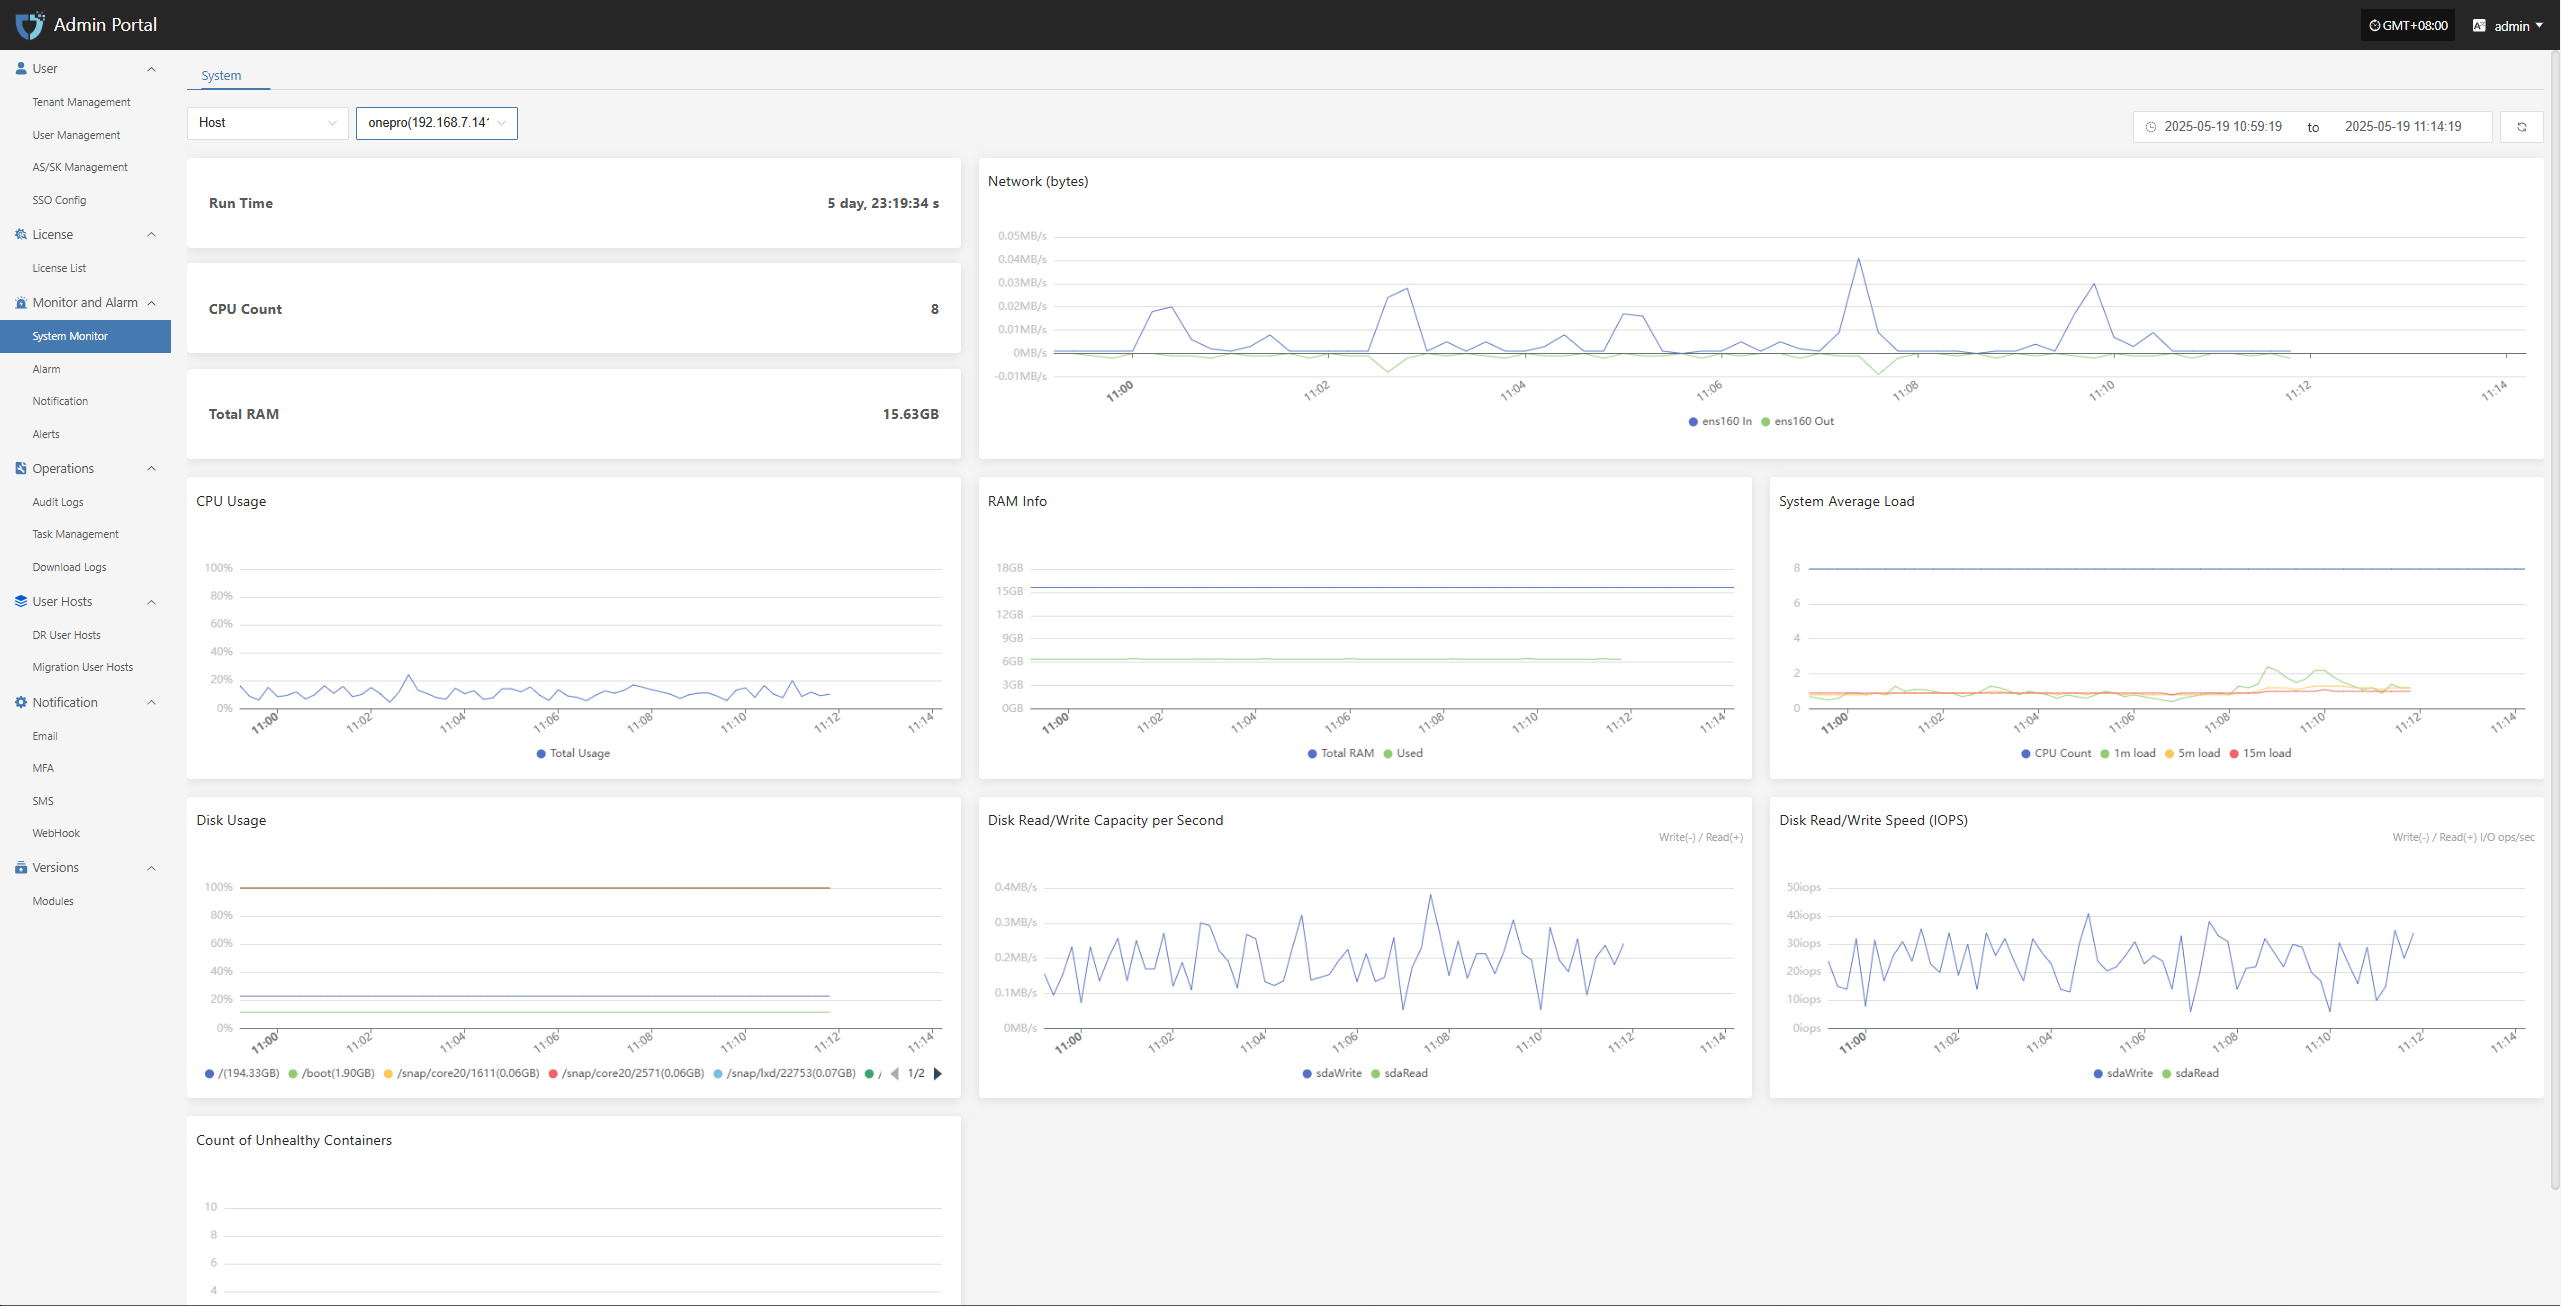
- Console Status: Log in to the HyperBDR Operations & Maintenance Management Platform and check the running status of each module, as well as the usage of key resources such as CPU, memory, and storage.
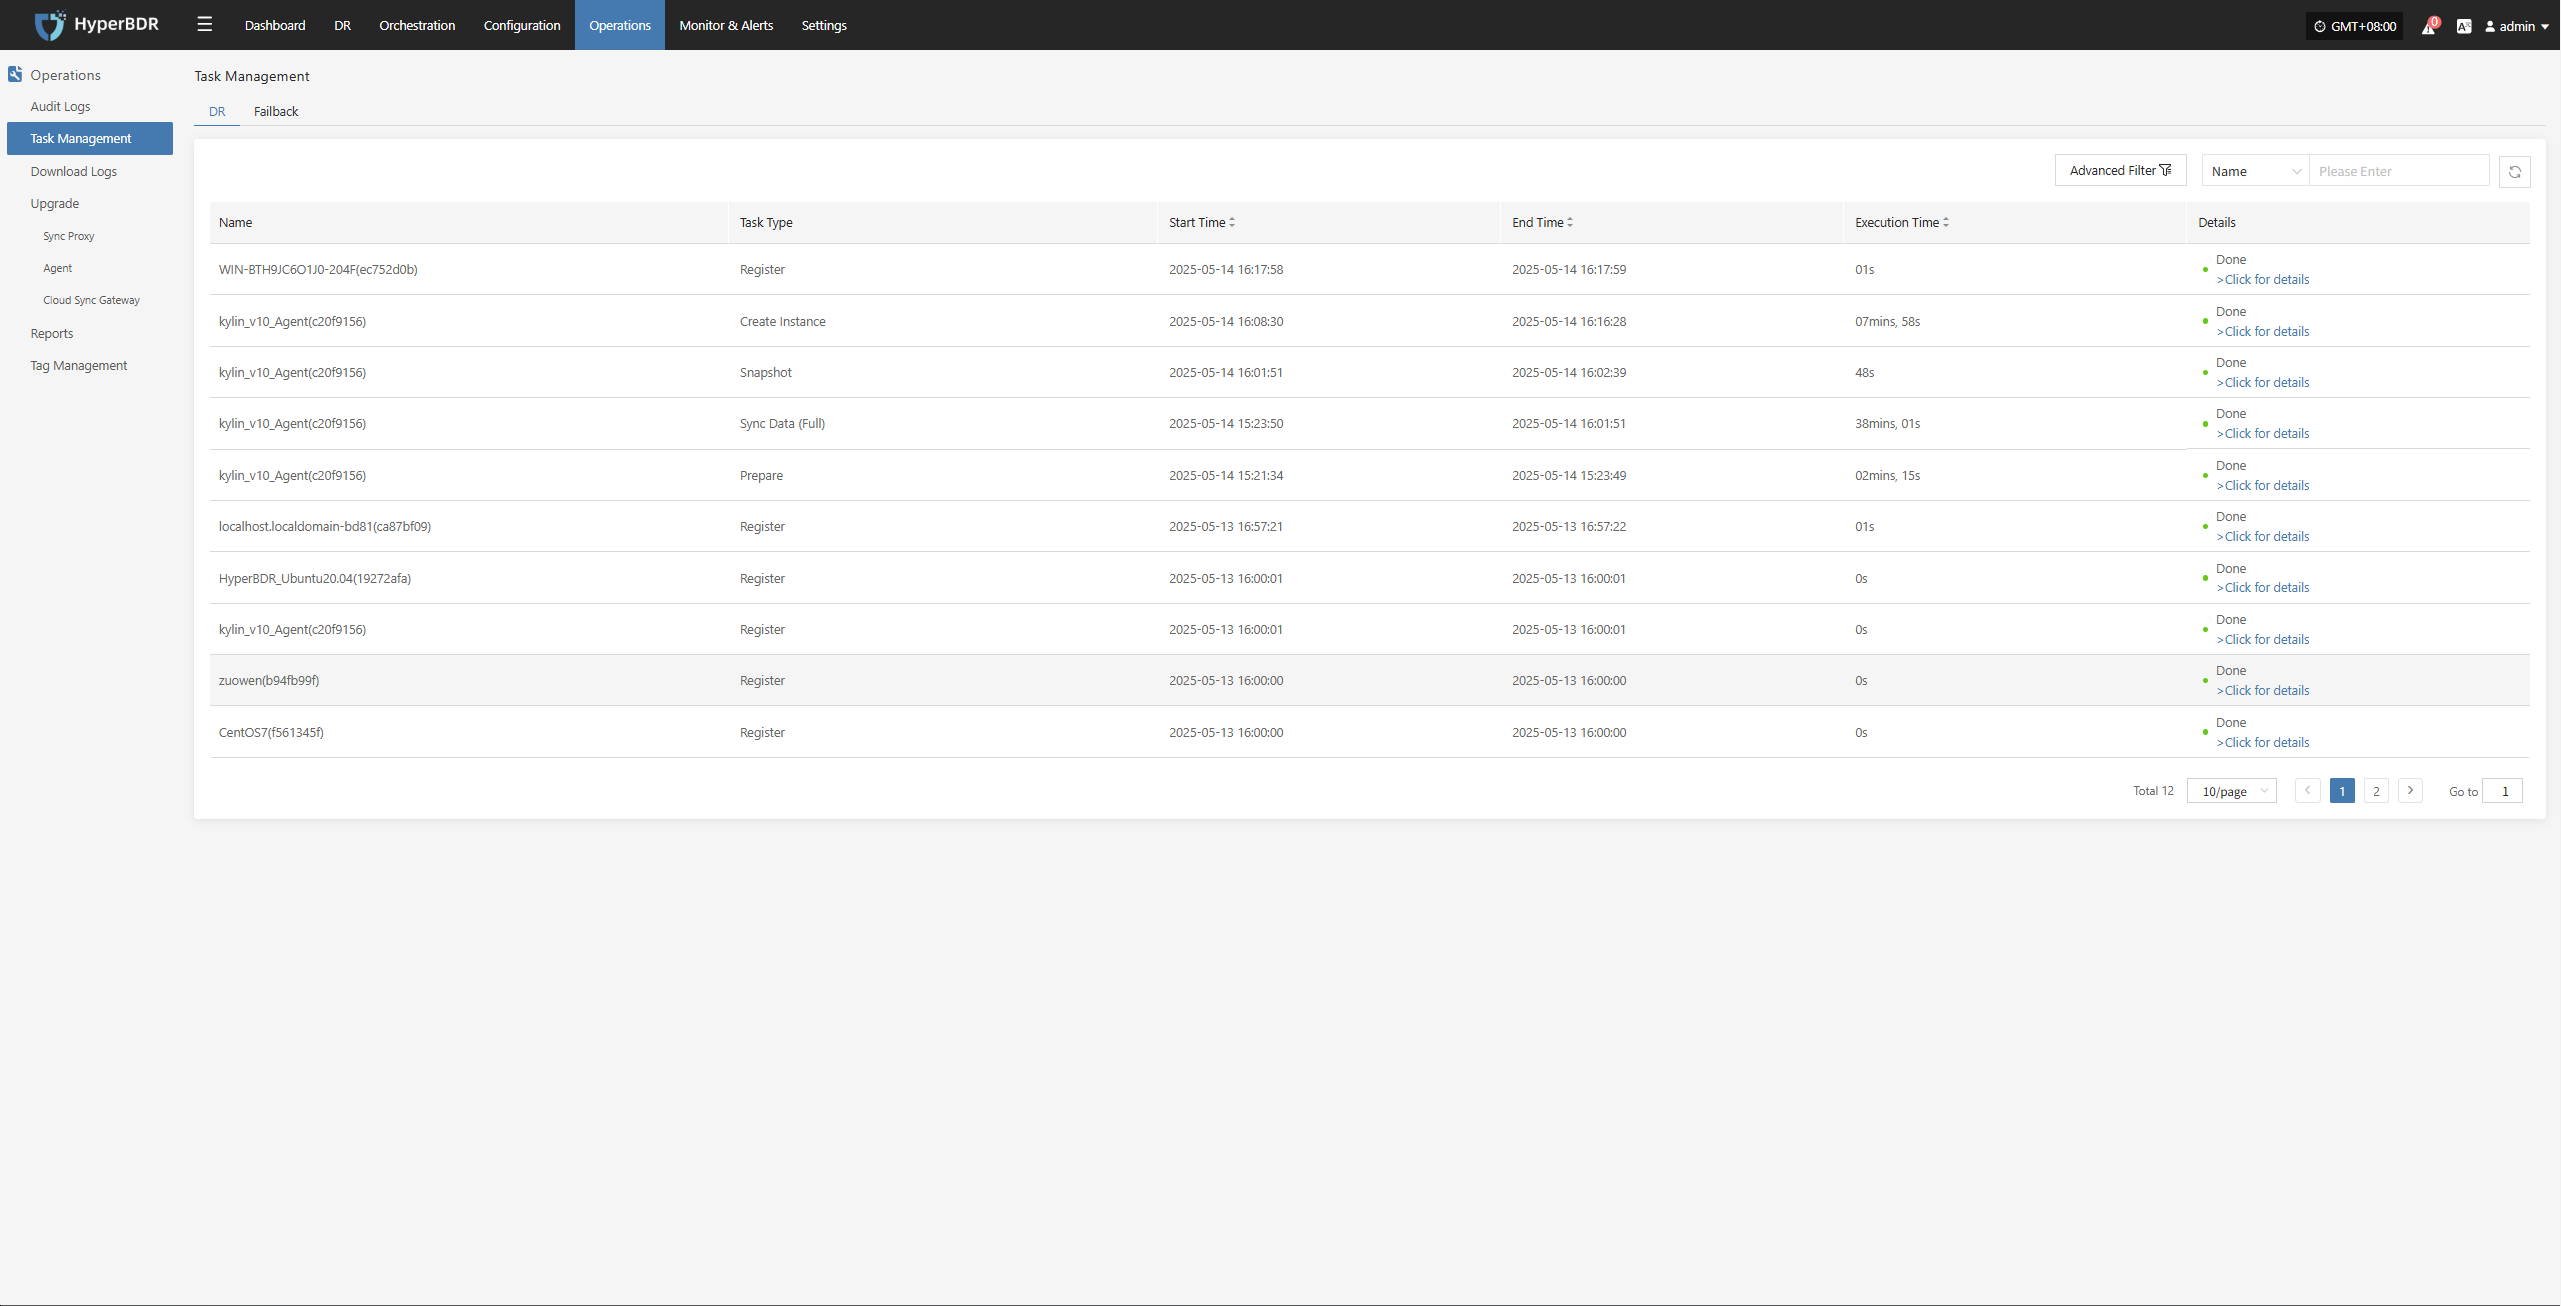
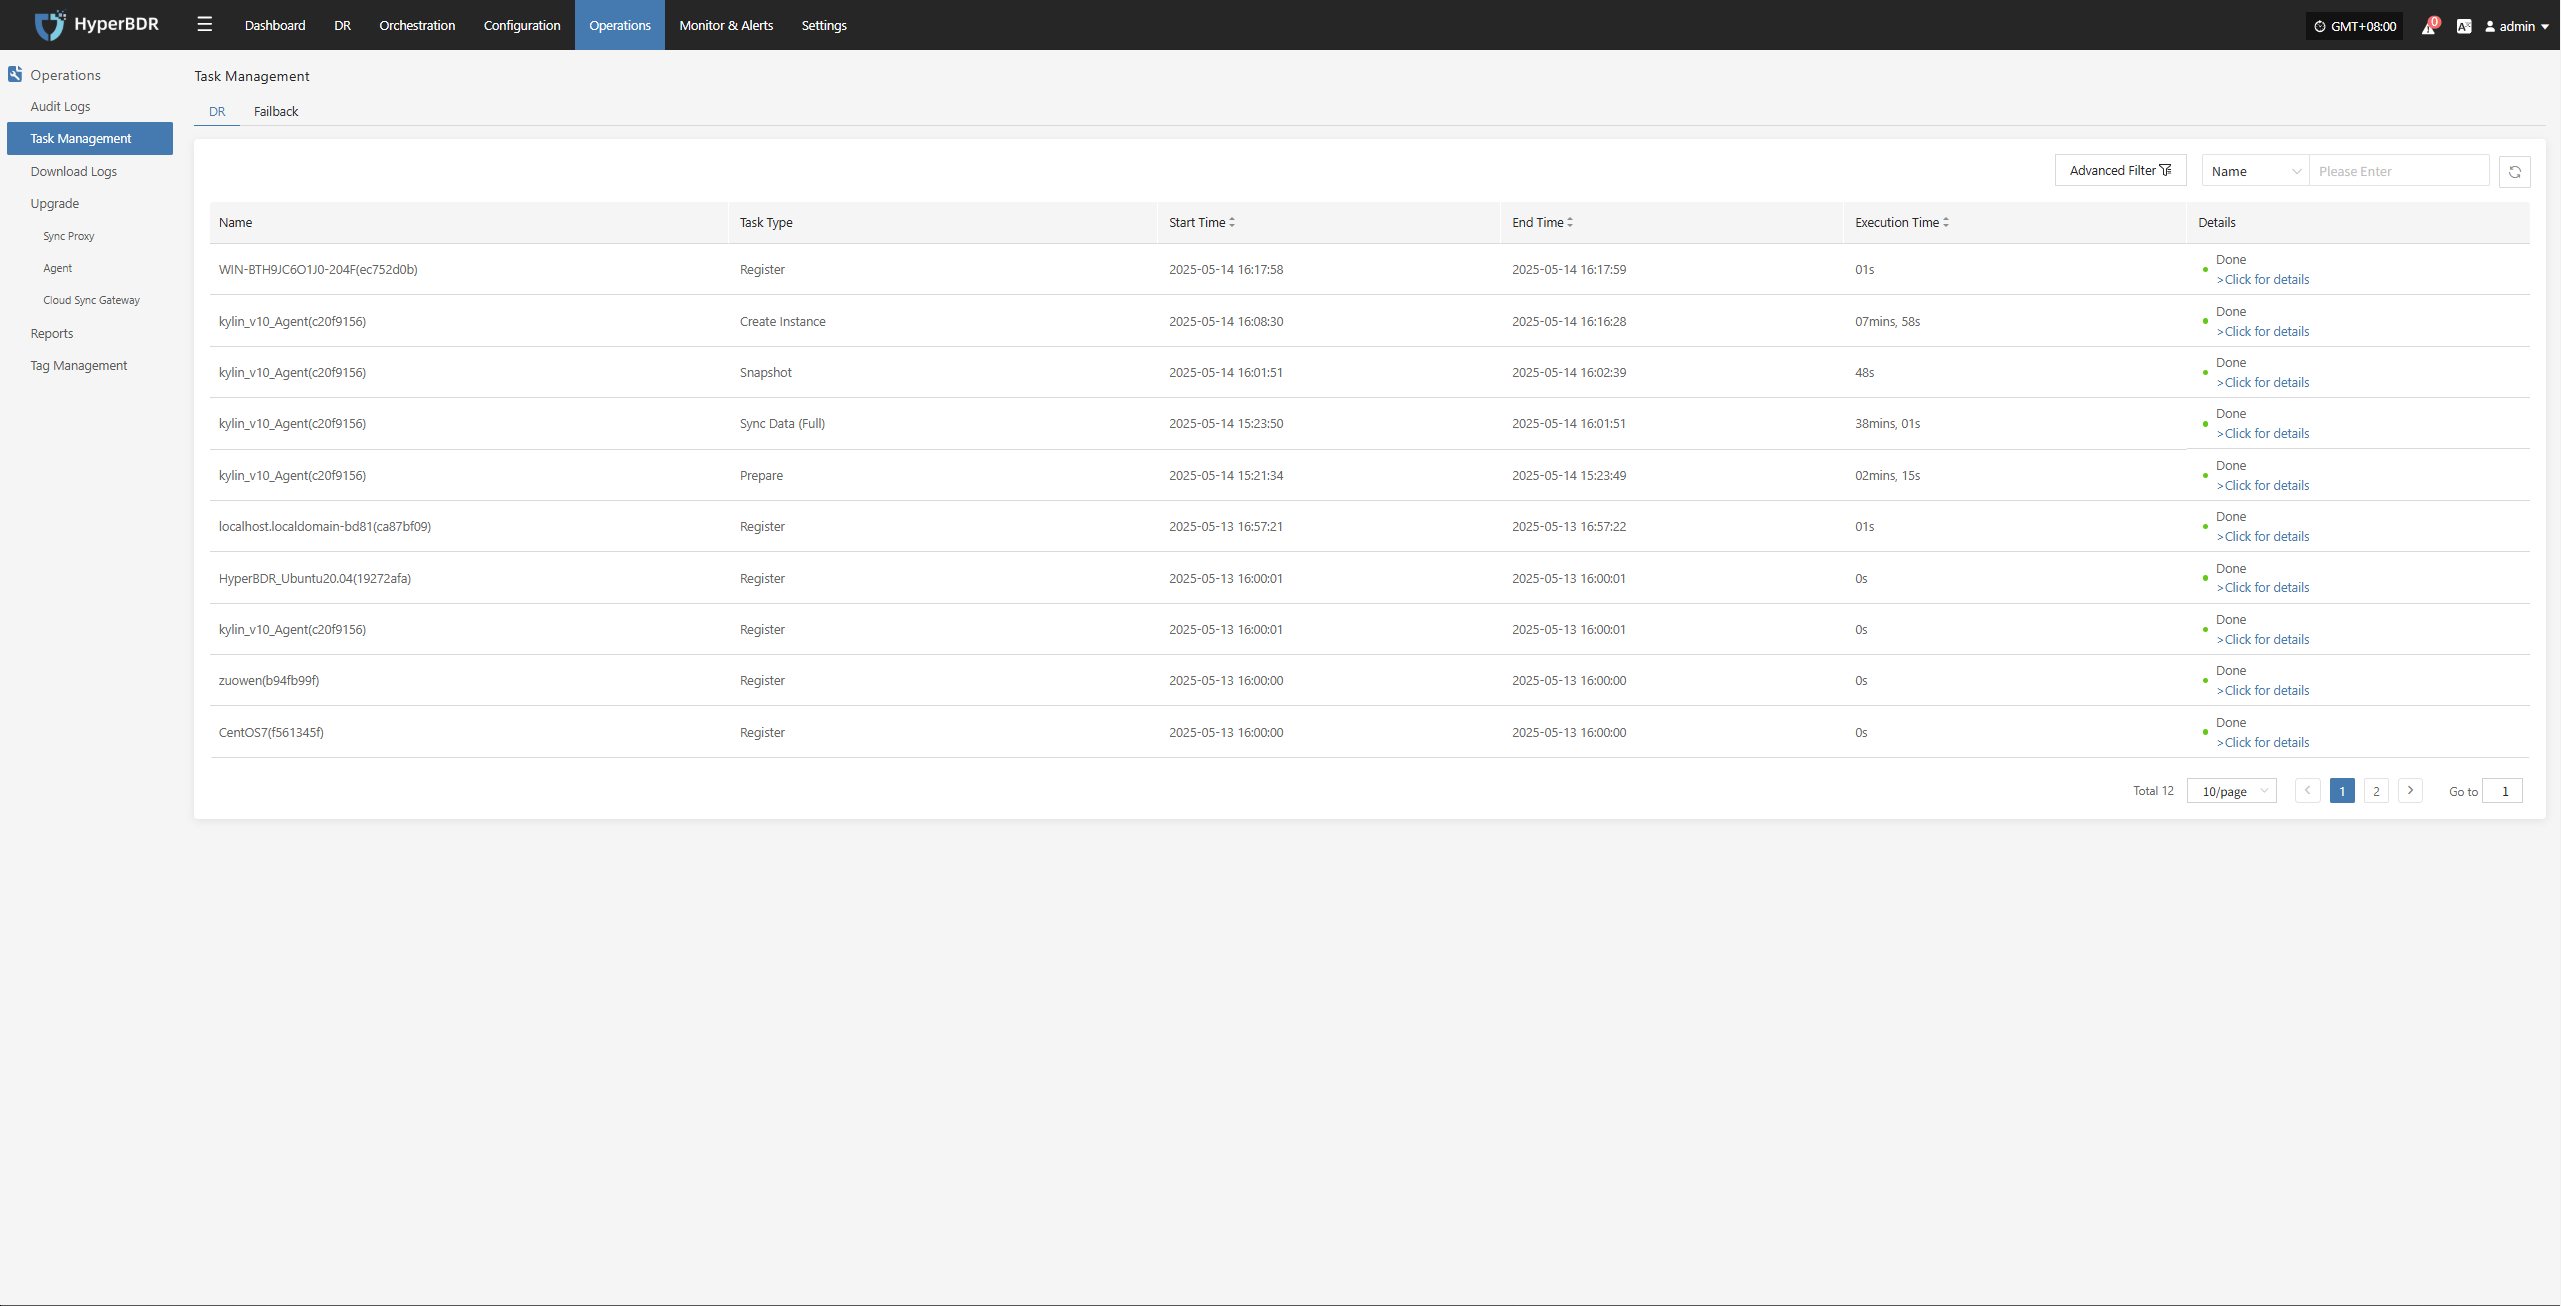
- Backup Task List: Review the execution status of all backup tasks to confirm if there are any failed or excessively delayed tasks.
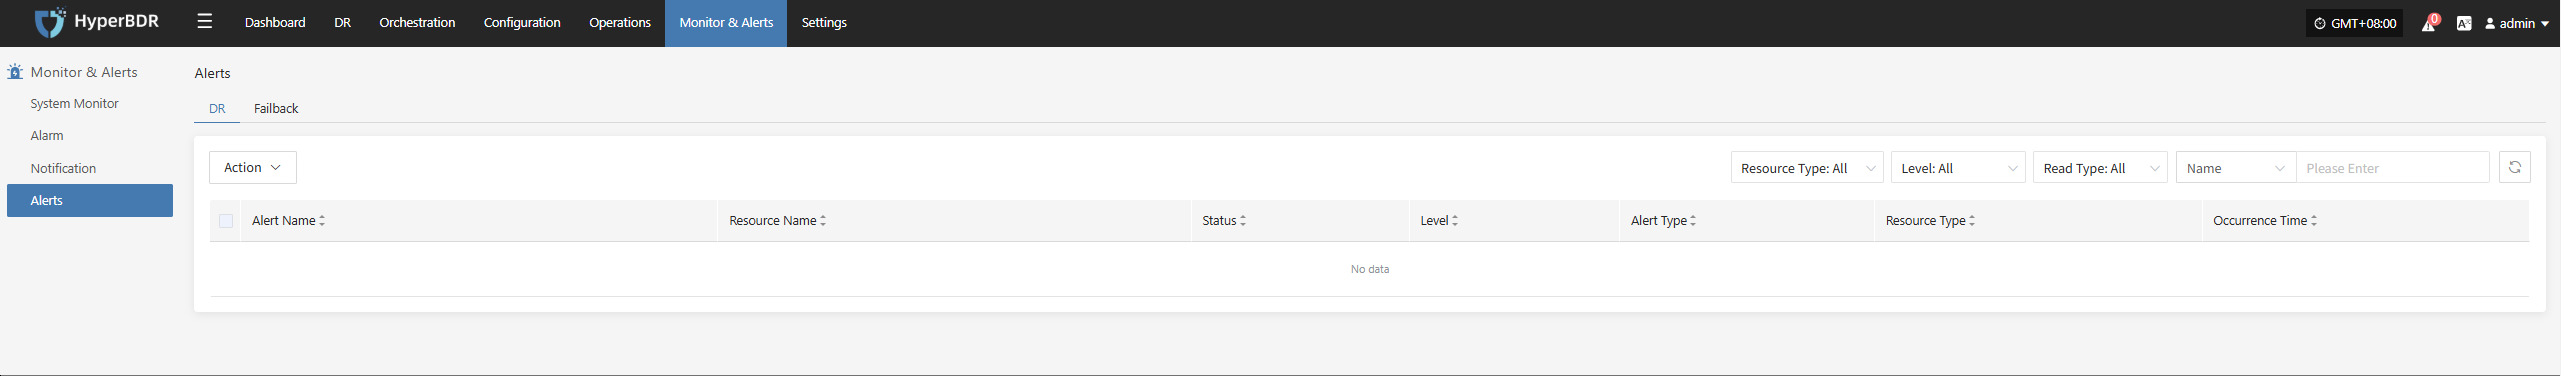
- Logs and Alerts: Use the log management module to check for abnormal alerts or error logs.
Network Connectivity
Ensure that the network connection between the source (production environment) and the target (disaster recovery environment or cloud platform) is stable and has sufficient bandwidth.
If using VPN, dedicated line, or VPC Endpoint, regularly check the tunnel status.
Cloud Accounts and Authorization
Regularly verify the validity of cloud platform accounts and check if any keys have expired.
Review account permissions to avoid excessive privileges or missing critical permissions that could cause backup or recovery failures.
Resource Monitoring and Backup Task Inspection
Resource Monitoring
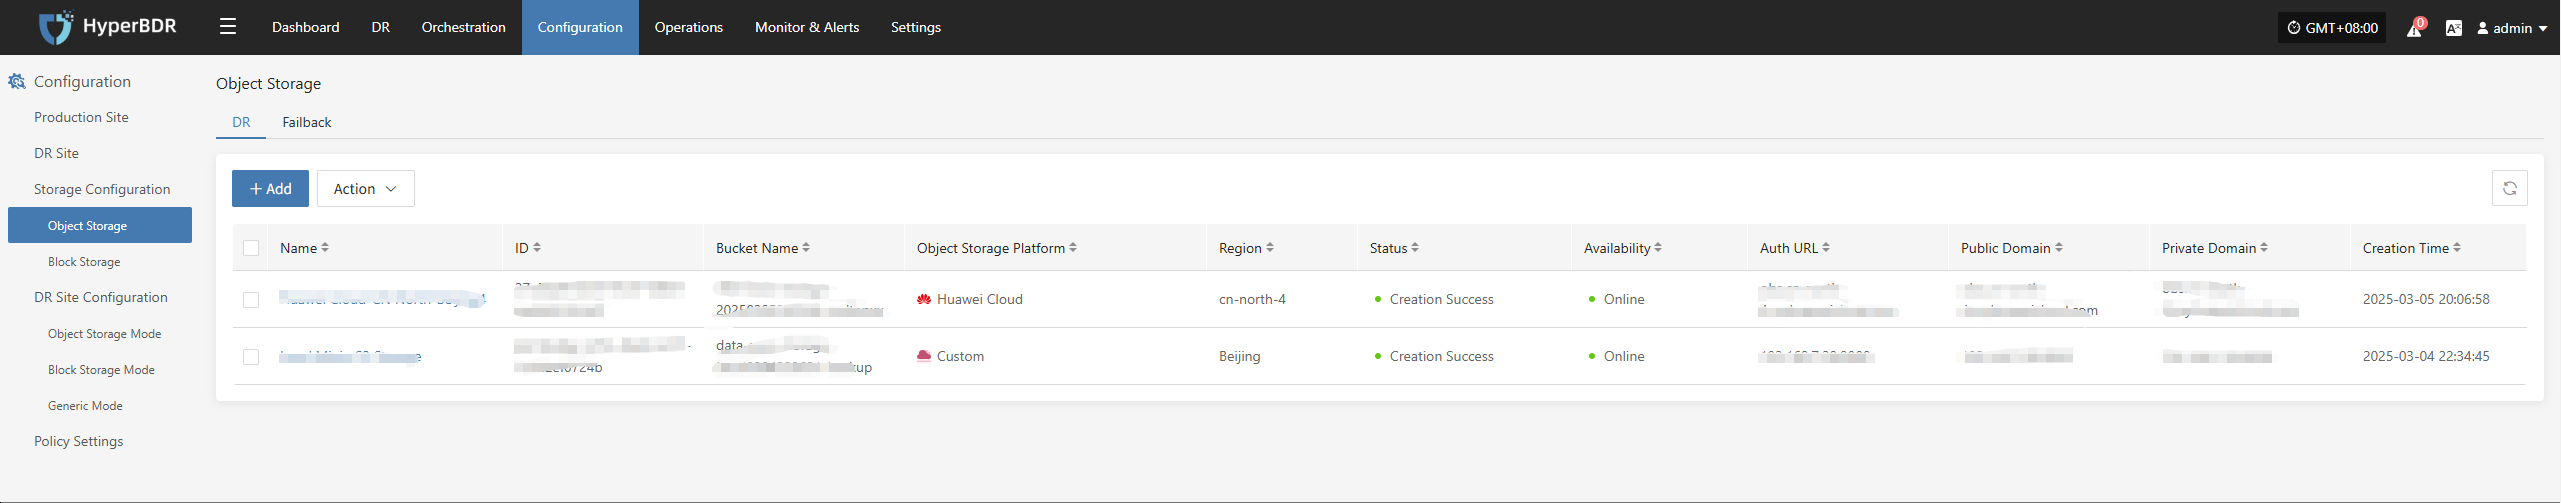
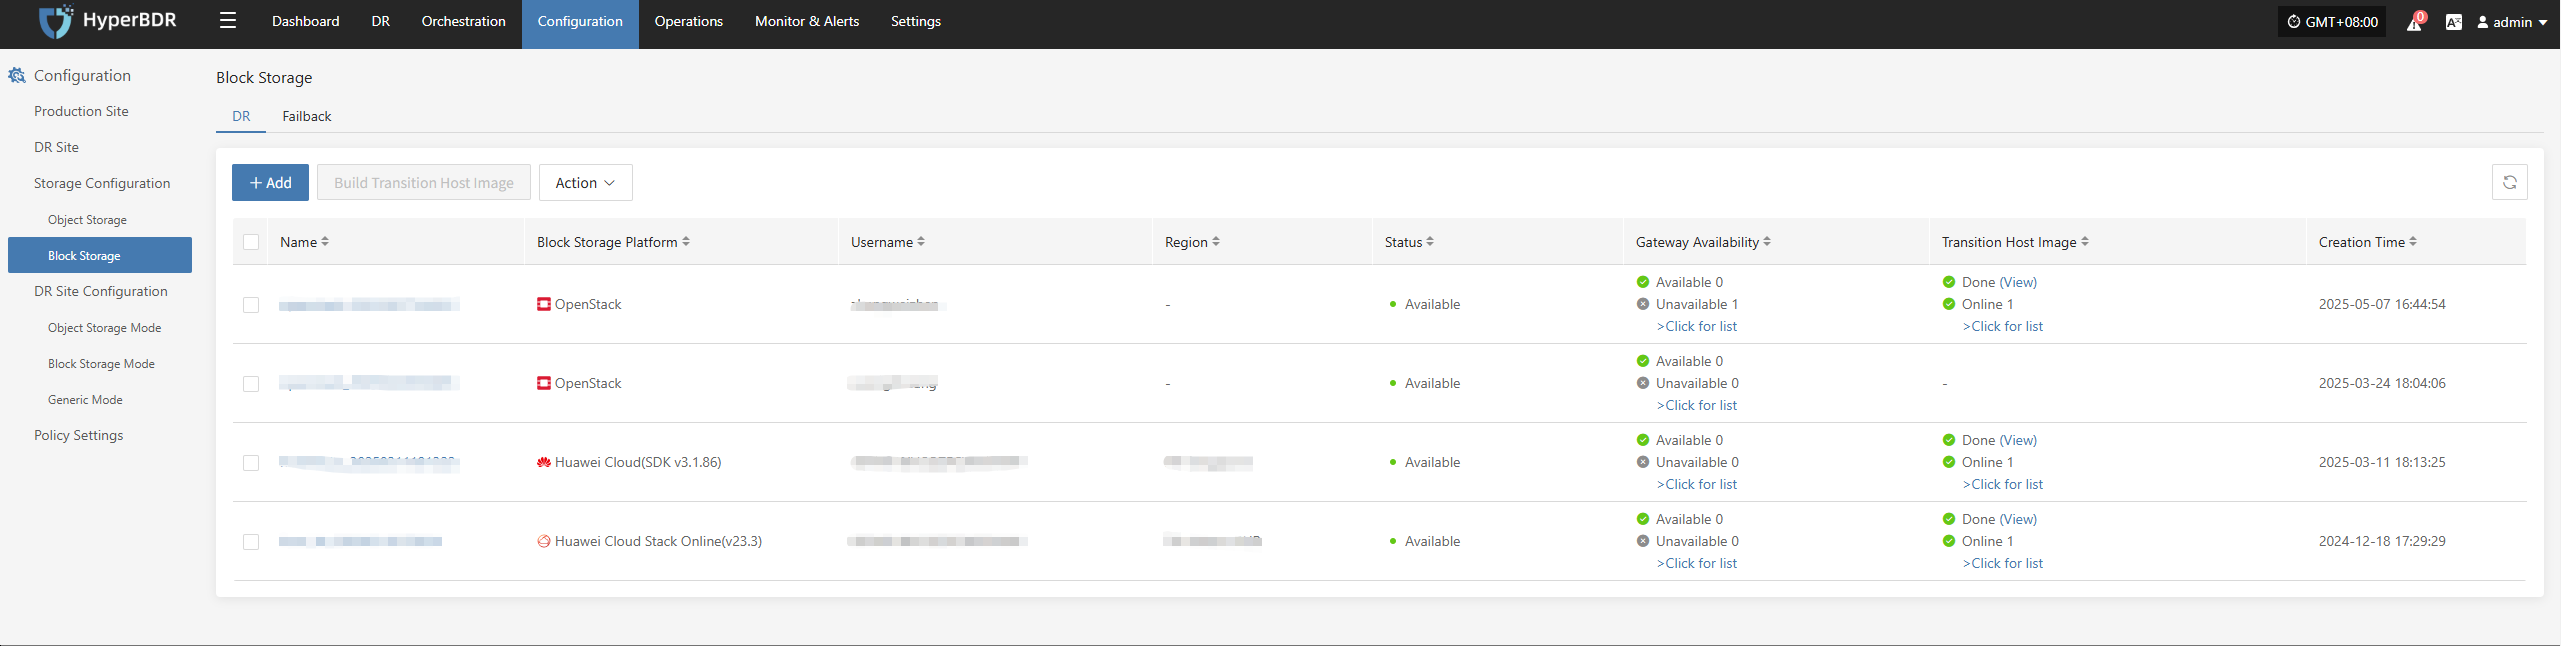
- Storage Space: Check the remaining capacity of object storage, block storage, and database storage. If space is insufficient, expand capacity or clean up historical snapshots in time.
- Network Throughput: Monitor bandwidth usage during backup peak periods. Upgrade bandwidth or adjust backup schedules as needed.
Backup Task Inspection
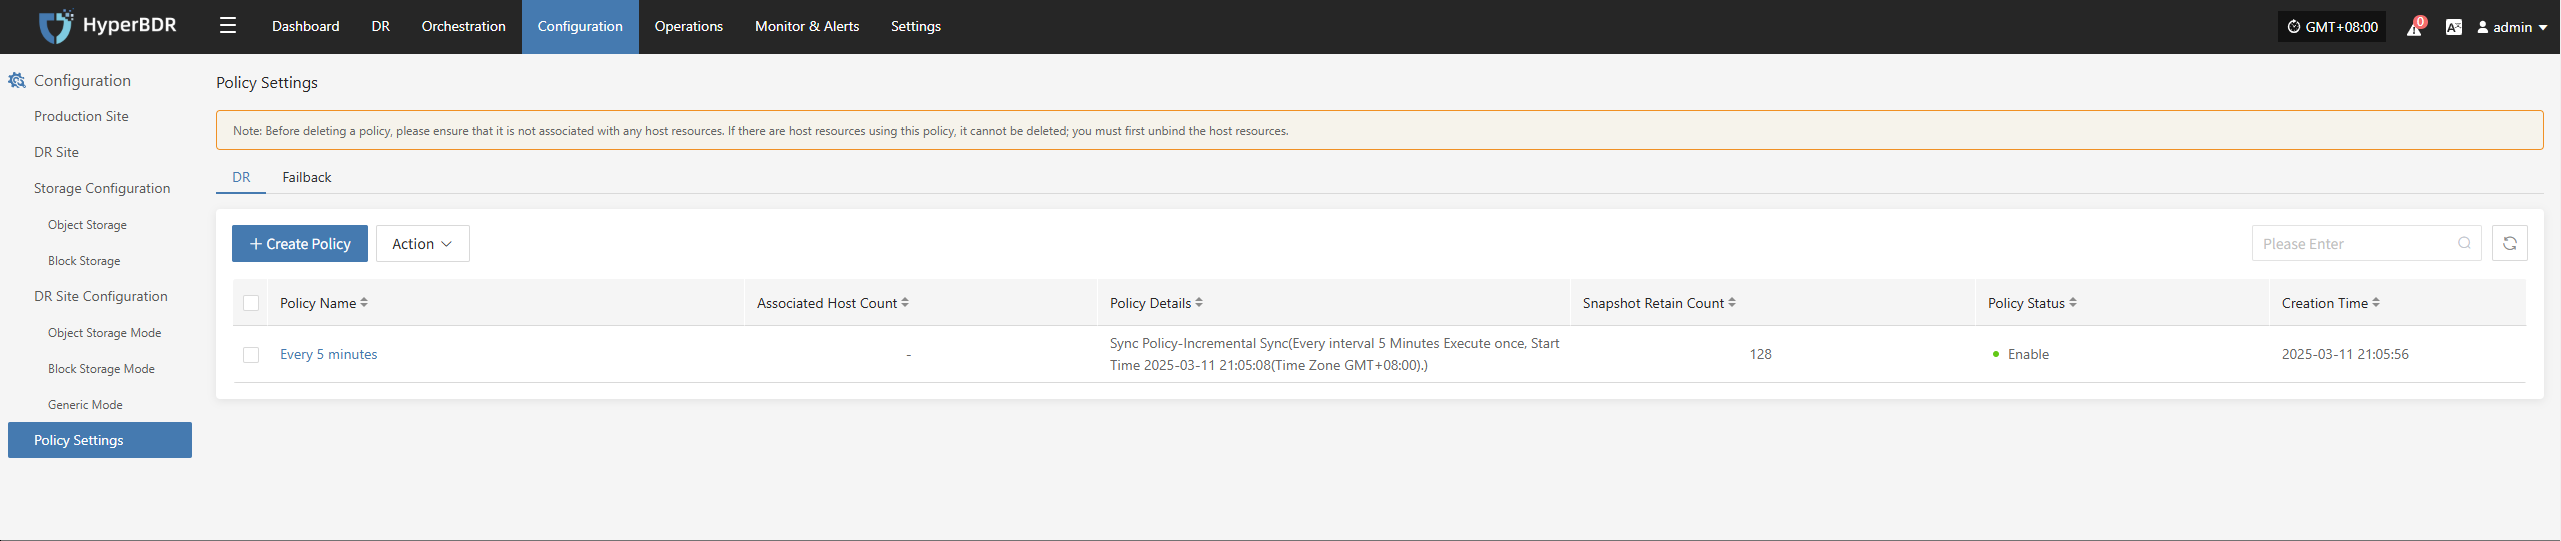
- Backup Strategy: Review backup strategies (full/incremental) weekly or monthly, and adjust backup frequency and retention periods according to business changes.
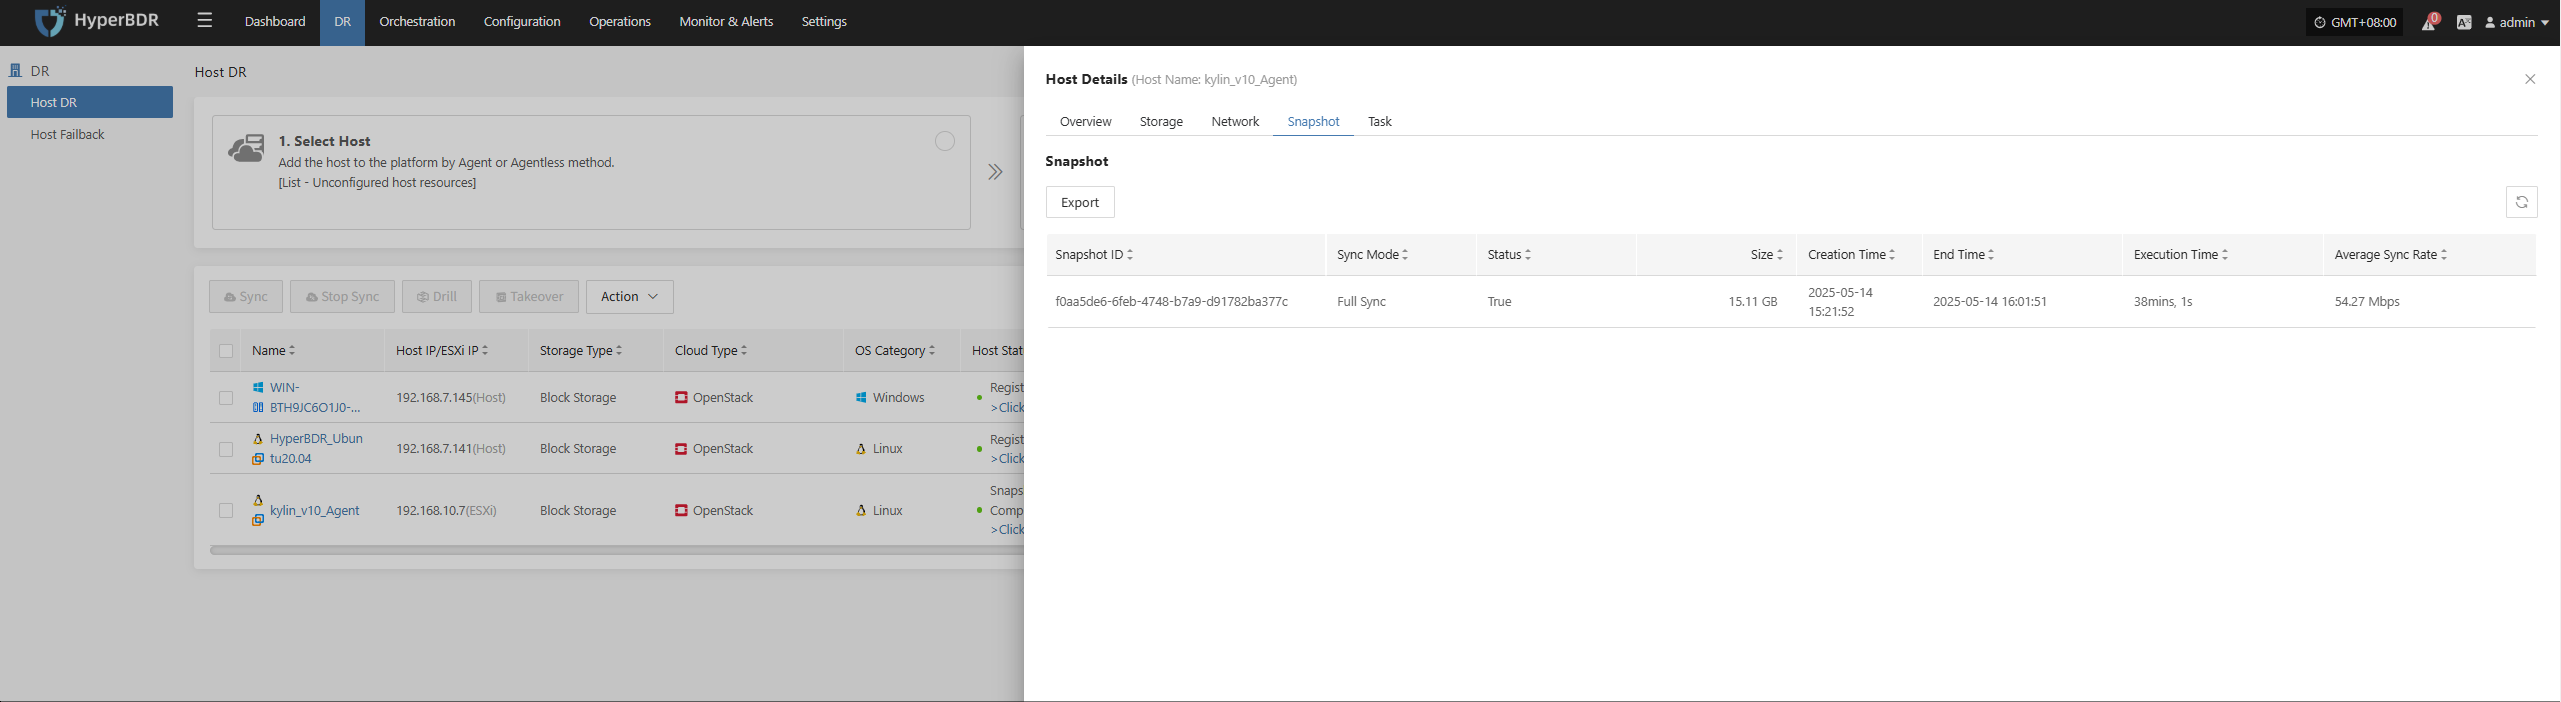
- Data Consistency Check: Regularly verify backup data or perform sample recovery tests to ensure data integrity and availability.
- Handling Abnormal Tasks: Analyze the causes of failed backup tasks (network, permissions, storage space, etc.), fix issues promptly, and re-execute the tasks.
Log Export
The log management feature allows you to quickly collect logs from service components for further analysis and troubleshooting when issues occur.
Console
Source Sync Proxy
Linux Host
Windows Host
Console Operations Maintenance
Runtime Environment
The Console is installed on a Linux host (e.g., Ubuntu 20.04). All console services run inside containers, with databases and middleware including MariaDB, Redis, RabbitMQ, and InfluxDB.
The system is installed under /opt/installer. The main files and directory structure are:
/opt/installer
├── HyperBDR_release_v6.4.0_20250430-20250430-1079.tar.gz.version  # Installation package version info
├── Version                                                        # Overall system version info
├── production/                                                   # Core directory for console operation
│   ├── config/                         # Service configuration files (e.g., MariaDB, Redis, Proxy)
│   ├── data/                           # Middleware persistent data (MySQL, Redis, RabbitMQ, InfluxDB)
│   ├── databackup/                     # Backup directory for MySQL, Redis, and configuration files
│   ├── docker-compose-hyperbdr.yml     # HyperBDR container orchestration config
│   ├── docker-compose-hypermotion.yml  # HyperMotion container orchestration config
│   ├── entrypoint.sh                   # System initialization and startup script
│   ├── init/
│   │   └── 01.sql                      # Database initialization SQL script
│   ├── logs/                           # Service logs (for troubleshooting)
│   ├── openssl.cnf                     # OpenSSL configuration (e.g., certificate generation)
│   ├── scripts/                        # Shell scripts for installation, upgrade, uninstall, backup, etc.
│   ├── softwares/                      # Bundled third-party tools (e.g., curl, ossutil, ttyd)
│   ├── ttyd                            # ttyd executable (web terminal service)
│   ├── venvs/                         # Python virtual environments for each service
│   └── version                        # Current deployment version info
The
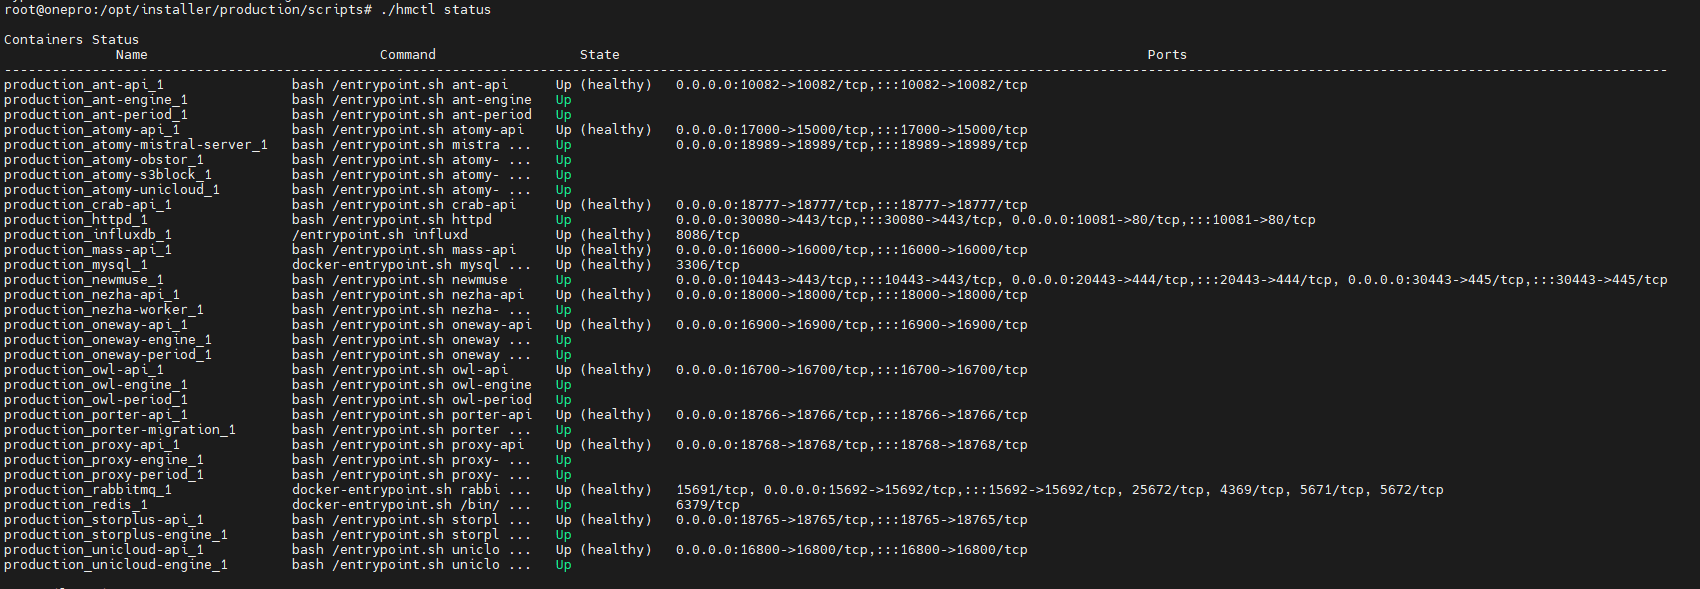
Statecolumn indicates service health status:Up: Service is running normallyUp (healthy): Container is running and health check passedExit/Restarting: Service is abnormal or failed to start
- Log disk usage

- Program disk usage

- Remaining disk space

- Health of service port 10443

Service Health Status
All services run as Docker containers. O&M staff can check the service status using the hmctl command.
Example:
/opt/installer/production/scripts/hmctl statusTip: Add the scripts directory to your PATH for global access:
echo 'export PATH=$PATH:/opt/installer/production/scripts' >> ~/.bashrc
source ~/.bashrc
The
Statecolumn indicates service health status:Up: Service is running normallyUp (healthy): Container is running and health check passedExit/Restarting: Service is abnormal or failed to start
- Log disk usage
- Program disk usage
- Remaining disk space
- Health of service port 10443
Service Start/Stop/Restart
O&M staff can start, stop, or restart services using the hmctl command.
Note: If the command is in your PATH, simply run:
hmctl <command>
Start all services
/opt/installer/production/scripts/hmctl startStart a specific service
/opt/installer/production/scripts/hmctl start <service-name>Stop all services
/opt/installer/production/scripts/hmctl stopStop a specific service
/opt/installer/production/scripts/hmctl stop <service-name>Restart all services
/opt/installer/production/scripts/hmctl restartRestart a specific service
/opt/installer/production/scripts/hmctl restart <service-name>Reload services
Note: Use this command only after updating the base image.
/opt/installer/production/scripts/hmctl reload
Log Management
All system log files are located under /var/log/installer. O&M staff can monitor system status, troubleshoot issues, or provide logs to project managers as needed.
/var/log/installer/
├── autoinstall-user-data                  # Auto-install user data config
├── block                                  # Disk block data, usually partition info
├── casper-md5check.json                   # MD5 check for installation image
├── curtin-install-cfg.yaml                # Curtin installation tool config
├── curtin-install.log                     # Curtin installation log
├── installer-journal.txt                  # Key installation event logs
├── media-info                             # Installation media information
├── subiquity-client-debug.log -> subiquity-client-debug.log.2396
├── subiquity-client-debug.log.2396
├── subiquity-client-info.log -> subiquity-client-info.log.2396
├── subiquity-client-info.log.2396
├── subiquity-curtin-apt.conf
├── subiquity-curtin-install.conf
├── subiquity-server-debug.log -> subiquity-server-debug.log.2463
├── subiquity-server-debug.log.2463
├── subiquity-server-info.log -> subiquity-server-info.log.2463
└── subiquity-server-info.log.2463
Log Collection
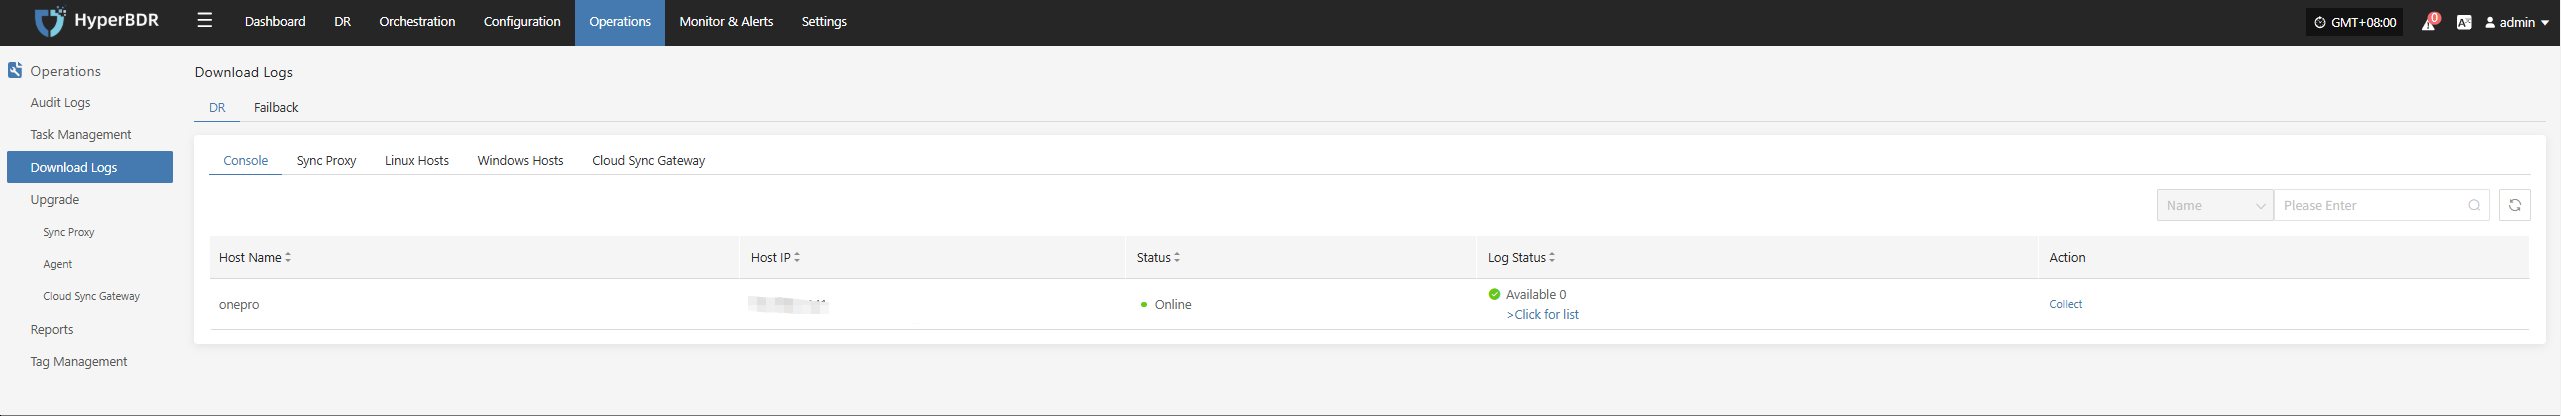
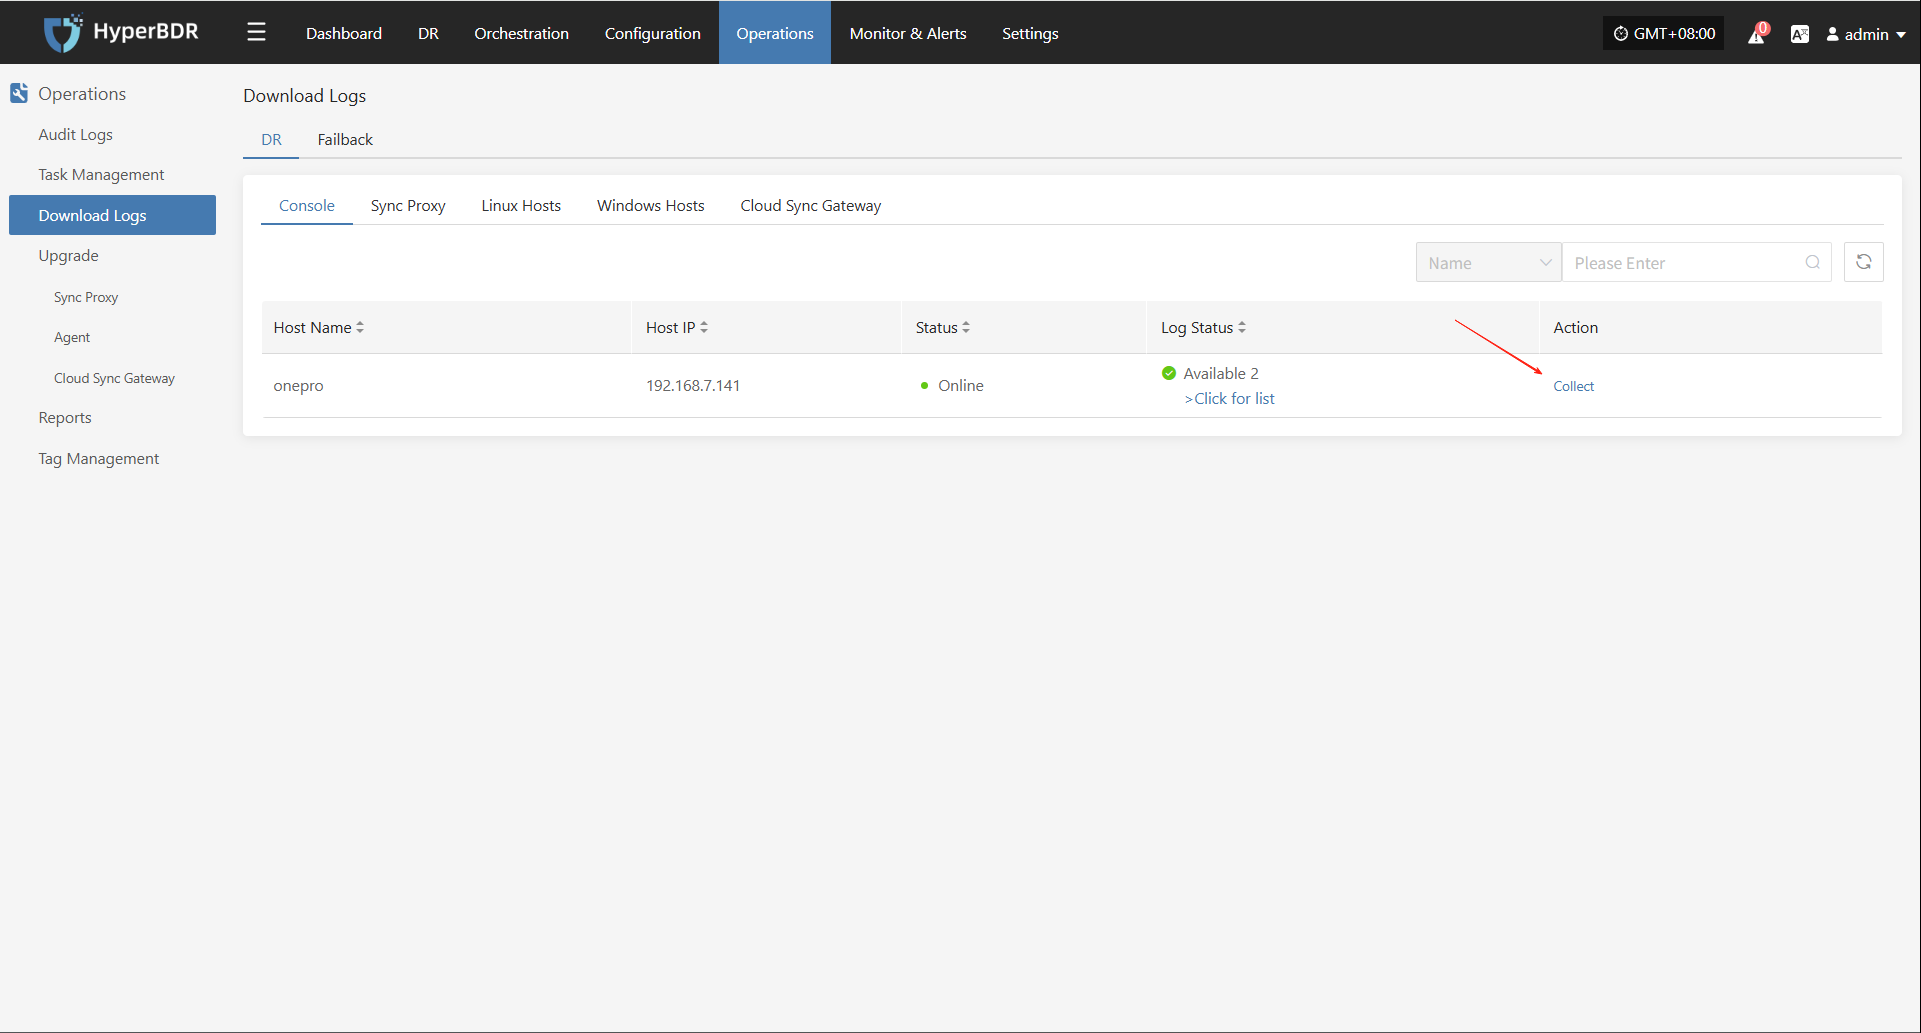
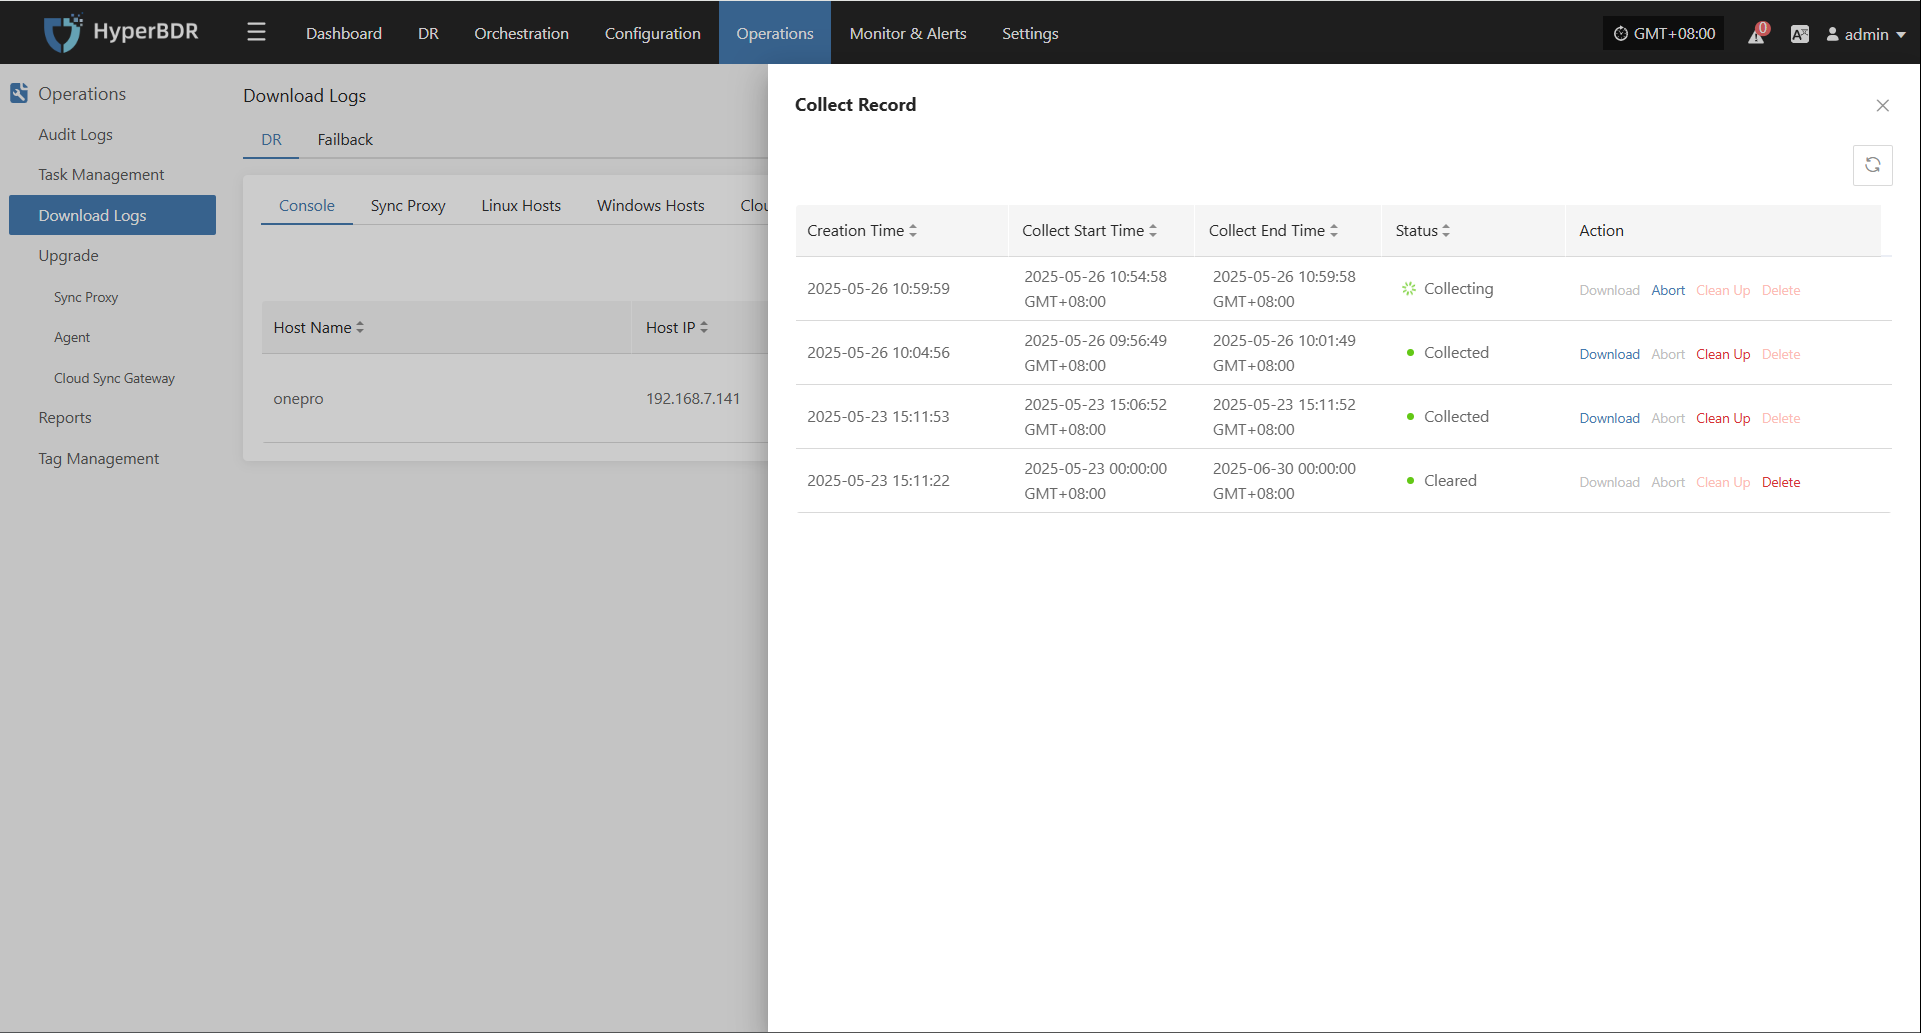
In the HyperBDR system, operations personnel can collect and download the required log files from the “Operations > Download Logs > DR | Failback > Console” page according to their needs, facilitating issue troubleshooting and system monitoring.
Select the target host and click the "Collect" button in the corresponding row.
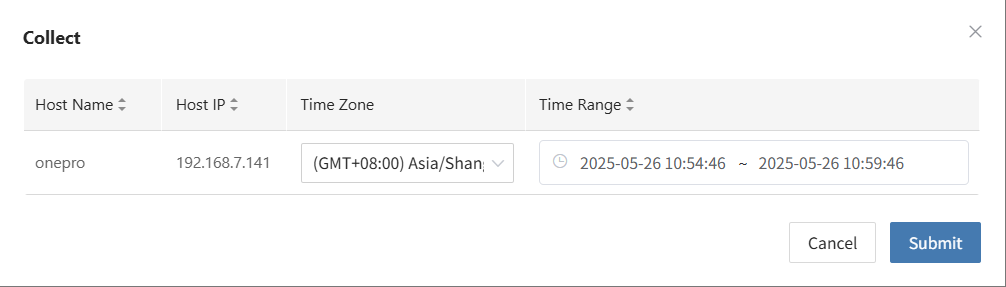
Select Time Range
In the pop-up dialog, set the time range for the logs you want to collect. After confirming, the system will automatically start collecting logs.
Start Collection
After confirming the time range, the system will automatically start collecting logs, and the log status will change to "Collecting".
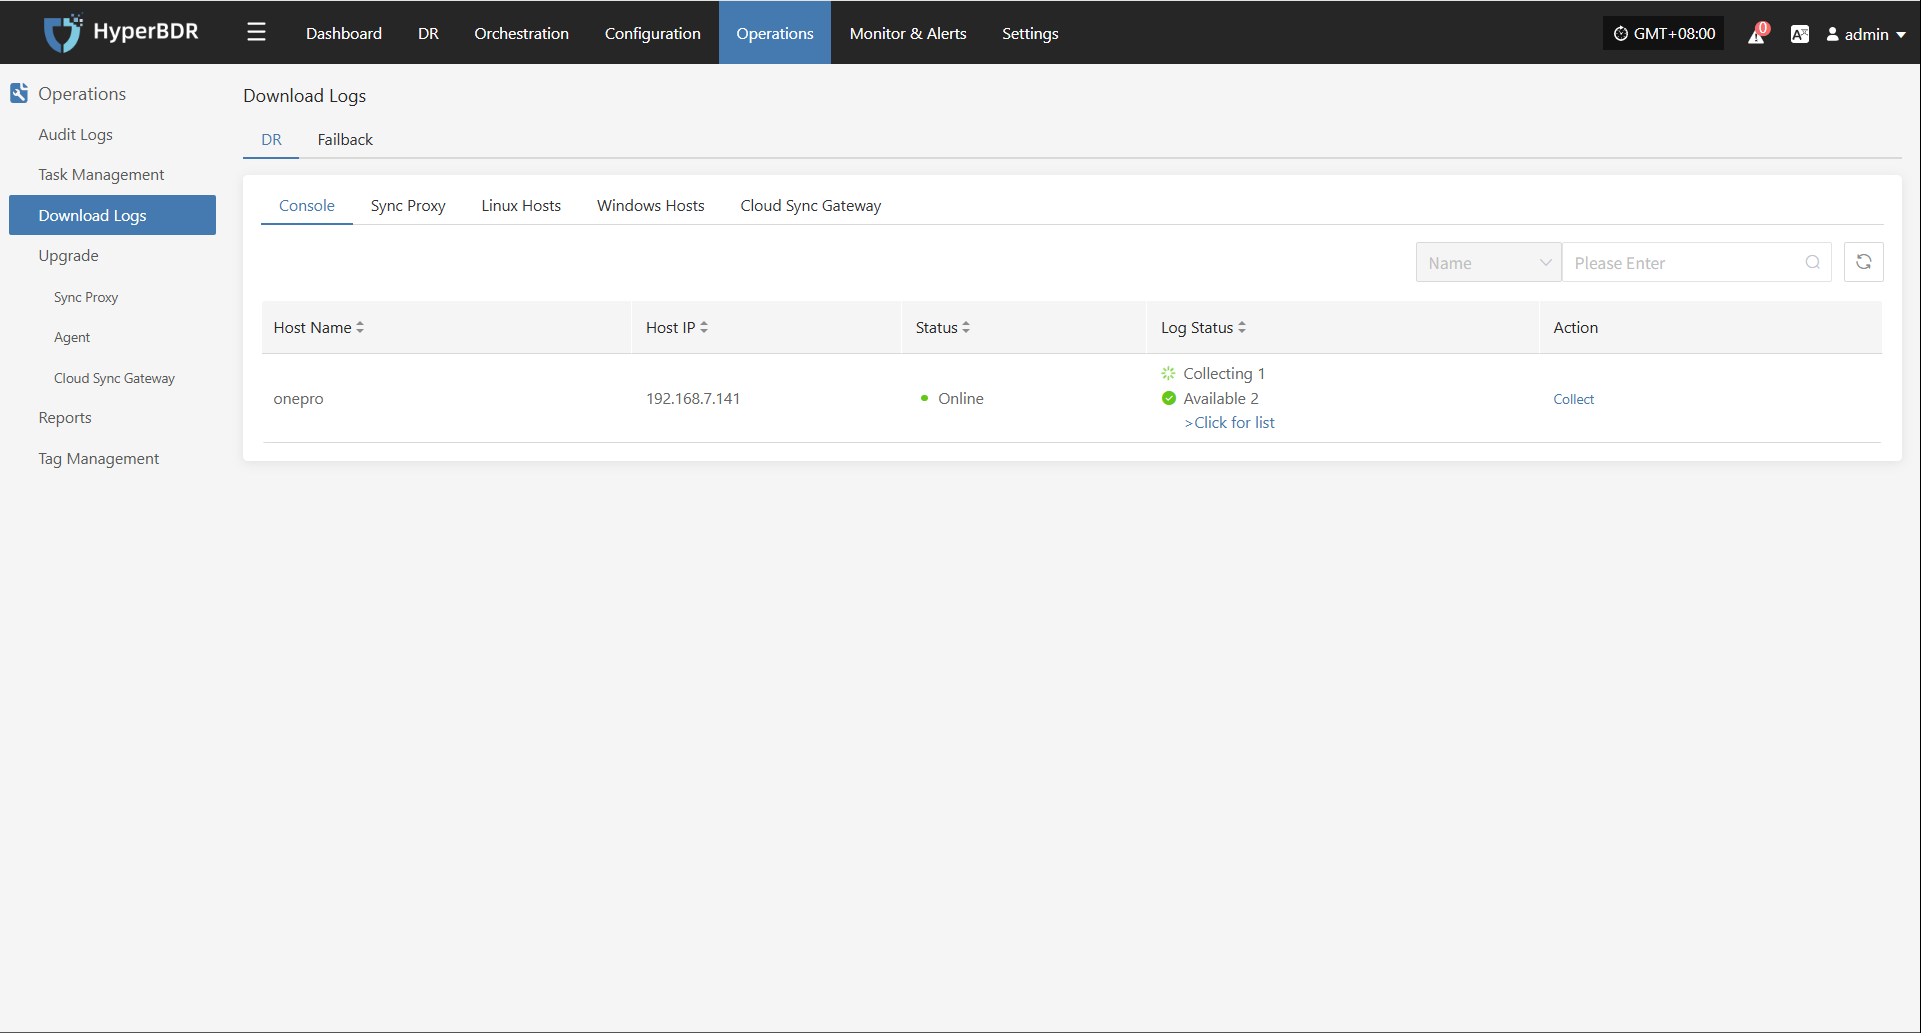
Download Logs
After log collection is complete, the status will update to "Available". Users can click "Click for list" to see the log files and select files to download.
Configuration File Management
All system configuration files are stored in /opt/installer/production/config. O&M staff can edit these files as necessary.
Due to the large number of configuration files, only an example for the
antservice is shown below:
[DEFAULT]
### Debug and logging options
debug = False
verbose = False
ant_api_listen = 0.0.0.0
ant_api_listen_port = 10082
transport_url = rabbit://guest:fs82BgKdU2QTr4Oy@rabbitmq:5672//

### Log rotation (commented out, enable if needed)
### log_rotation_type = size
### max_logfile_count = 10
### max_logfile_size_mb = 64

### API service settings
ant_api_workers = 1
proxy_base_url = http://proxy-api:18768
porter_base_url = http://porter-api:18766
porter_proxys_url = http://porter-api:18766/proxys
storplus_base_url = http://storplus-api:18765
OWL_BASE_URL = "http://owl-api:16700"

[database]
backend = sqlalchemy
connection = mysql://ant:antPass@mysql:3306/ant?charset=utf8
use_db_reconnect = True
max_pool_size = 30
max_overflow = 20
pool_timeout = 30
connection_recycle_time = 300

[period]
interval = 5
timeout = 86400
Sync Proxy Operations Maintenance
Runtime Environment
The agentless proxy is installed on the source host and captures data changes directly through the cloud platform's API or virtualization management interfaces (such as VMware vCenter). This enables non-intrusive data synchronization, making it suitable for virtualized environments, simplifying deployment, and reducing system resource usage.
The Linux agentless proxy is deployed on an Ubuntu 24.04 host. The recommended configuration is 4-core CPU, 8GB RAM, 50GB disk, using ext4 or xfs file systems (LVM partitions are not supported).
The system is installed in the /opt/hamal directory. The main files and directory structure are as follows:
/opt/hamal
├── docker-compose-hamal.yaml      # Docker Compose configuration for Hamal services
├── hamal-venv                     # Python source package
│   ├── bin                        # Python executables
│   ├── etc                        # Configuration files
│   ├── hamal3-changelog.txt       # Hamal version changelog
│   ├── include                    # Include directory (typically C libraries, etc.)
│   ├── lib                        # Python library files
│   ├── project_etc                # Project-specific configuration files
│   ├── pyvenv.cfg                 # Python virtual environment config
│   ├── tools                      # Tools directory
│   └── version                    # Version file for the current virtual environment
├── uninstall_hamal.sh             # Script to uninstall Hamal services
└── update_sync_proxy.sh           # Script to update the sync proxy
Service Health Status
Agentless services run as Docker containers. Operations staff can check service status with the following command:
cd /opt/hamal
docker-compose -f docker-compose-hamal.yaml ps
The output will show the running status of the services. Pay attention to the State column:
Up: Service is running normallyUp (healthy): Container is running and health check passedExit/Restarting: Service is abnormal or failed to start

Service Start/Stop/Restart
Operations staff can use docker-compose to manage the start, stop, and restart of agentless services.
Start service:
docker-compose -f /opt/hamal/docker-compose-hamal.yaml up -dStop service:
docker-compose -f /opt/hamal/docker-compose-hamal.yaml downRestart service:
docker-compose -f /opt/hamal/docker-compose-hamal.yaml restart
Log Management
All system log files are stored in the /var/log/hamal directory. Operations staff can check log files to monitor system status, troubleshoot issues, or provide relevant files to project managers to ensure system stability.
/var/log/hamal
├── hamal-period.log                   # Main log for Hamal scheduled tasks (about 188KB)
├── hamal-period-subprocess.log        # Subprocess log for Hamal scheduled tasks (about 10KB)
├── ip_mapping.backup                  # Backup file for IP mapping (currently empty)
├── vm-kylin_v10_Agent-<UUID>.log      # VM agent logs, can be used to determine sync status
Log Collection
In the HyperBDR system, operations personnel can collect and download the required log files from the “Operations > Download Logs > DR | Failback > Sync Proxy” page according to their needs, facilitating issue troubleshooting and system monitoring.
Select the target host and click the "Collect" button in the corresponding row.
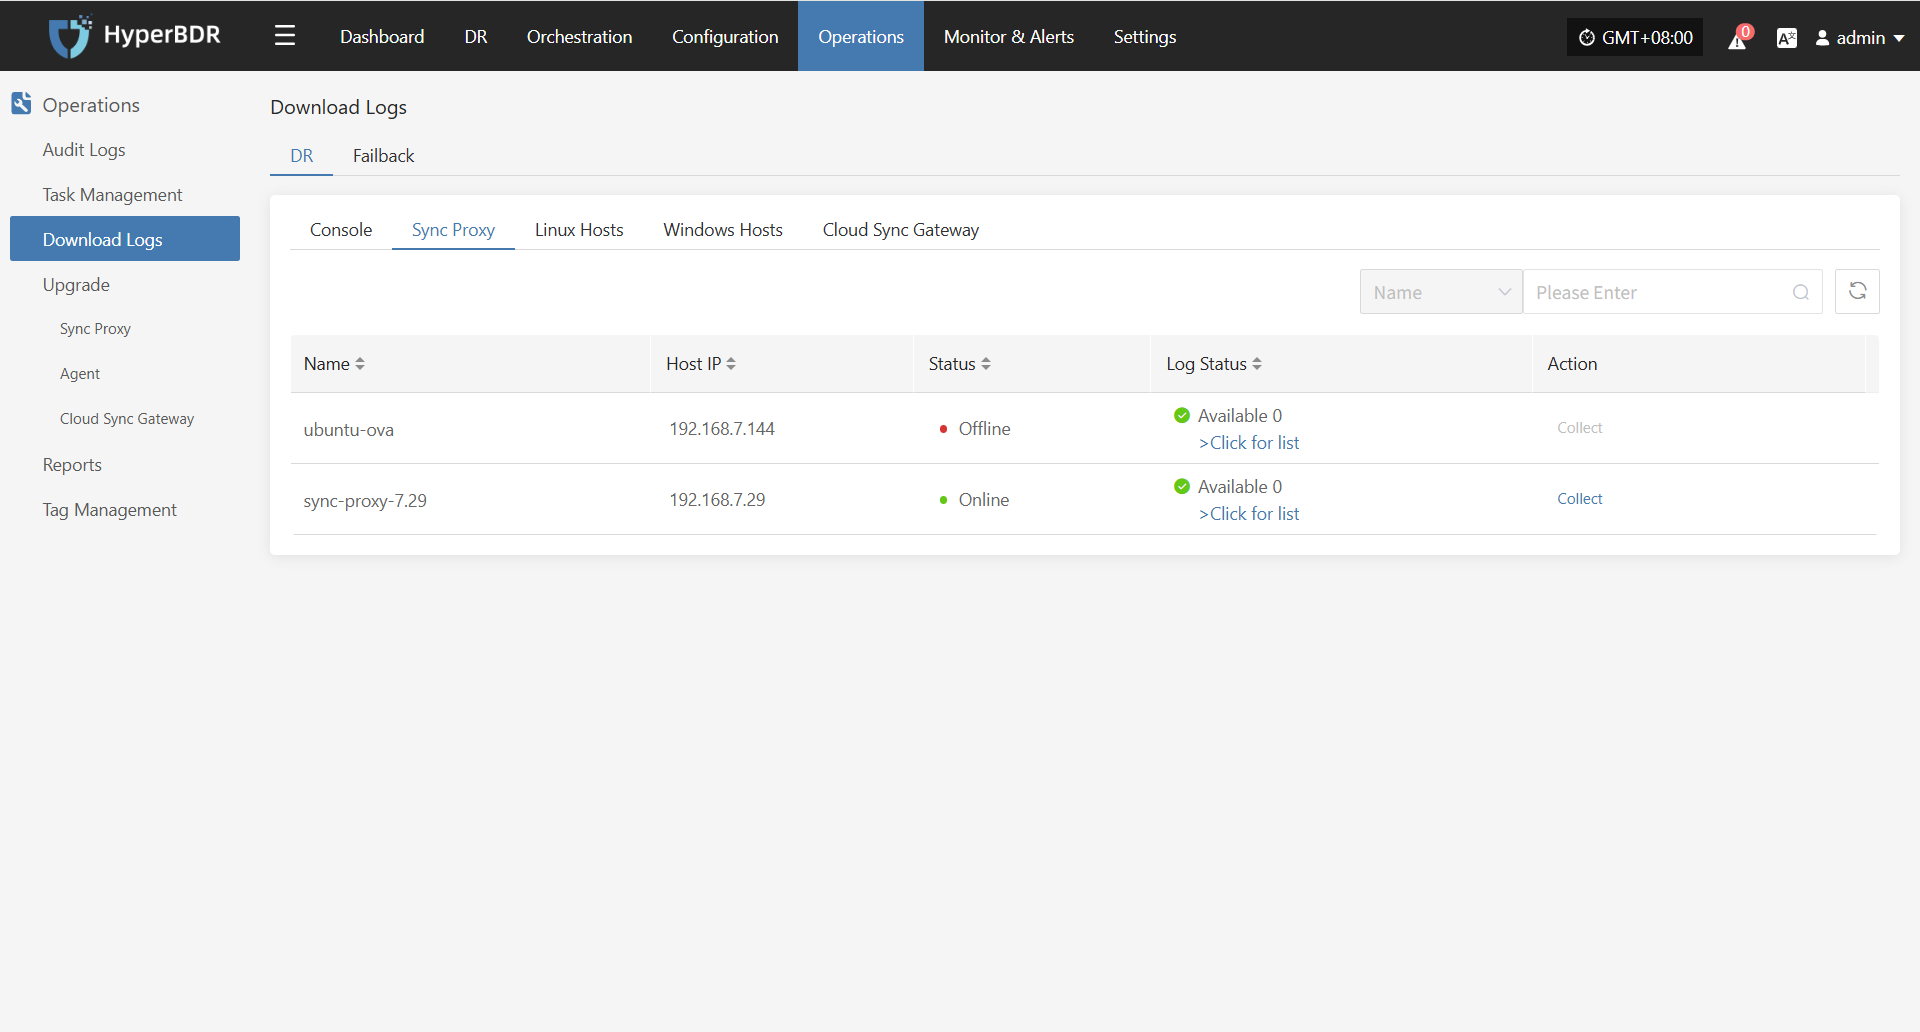
Select Time Range
In the pop-up dialog, set the time range for the logs you want to collect. After confirming, the system will automatically start collecting logs.
Start Collection
After confirming the time range, the system will automatically start collecting logs, and the log status will change to "Collecting".
Download Logs
After log collection is complete, the status will update to "Available". Users can click "Click for list" to see the log files and select files to download.
Configuration File Management
The main configuration file for the Linux agentless proxy is located at /etc/hamal/hamal.conf. This file contains all configuration information for agentless mode, including service connections, database, sync tasks, logs, S3 settings, and more.
Below are the main sections of the configuration file and their descriptions:
[DEFAULT]
debug = False                                # Enable debug logs
verbose = False                              # Enable verbose logs
log_rotation_type = size                     # Log rotation by size
max_logfile_count = 10                       # Max number of log files
max_logfile_size_mb = 64                     # Max size per log file (MB)
hamal_lib_dir = /var/lib/hamal/              # Program data directory
hamal_info_path = /var/lib/hamal/hamal_info  # Program info file path

[period]
interval = 60                                # Interval for scheduled tasks (seconds)
task_update_wait_time = 1                    # Wait time for task updates (seconds)
openstack_release_cpu_time = 0               # CPU time per MB for OpenStack (ms)
vmware_release_cpu_time = 0                  # CPU time per MB for VMware (ms)

[mass]
mass_endpoint = https://192.168.7.141:10443/hypermotion/v1  # Mass service API address
auth_key = 315d65ca-ef28-4e63-ad72-1260a91adf23             # Auth key
hyper_exporter_id = aaeb0d1fbbb14093837fb5f900b9f8ce        # Unique ID for Hyper Exporter
public_key_path = /etc/hamal/public_key                     # Public key path
default_request_timeout = 600                               # Request timeout (seconds)
enable_get_public_ips = False                               # Enable public IP retrieval
get_public_ip_timeout = 5                                   # Public IP retrieval timeout (seconds)
enable_heartbeat_msg = True                                 # Enable heartbeat reporting

[vmware]
skip_disk_flag = False                                      # Skip disk flag check
disk_flag_size = 48                                         # Minimum disk size for flag (MB)
max_read_blocks = 1024                                      # Max blocks per read

[openstack_ceph]
skip_disk_flag = False                                      # Skip disk flag check
disk_flag_size = 48                                         # Minimum disk size for flag (MB)

[sync]
save_local_snapshot_metadata = False                        # Save snapshot metadata locally
upload_metadata_to_oss = False                              # Upload metadata to OSS

[data_sync_v2]
fsync_period_frequency = 3                                  # Metadata sync frequency (seconds)
fsync_timeout = 0                                           # Sync timeout (seconds)
parallel_sync_disks_count = 4                               # Number of disks to sync in parallel
pre_disk_readers_count = 2                                  # Preprocessing disk reader threads
max_parallel_sync_disks_count = 16                          # Max parallel disk syncs
max_pre_disk_readers_count = 16                             # Max preprocessing disk readers

[fusion_compute]
task_timeout = 3600                                         # Task timeout (seconds)
create_snap_task_timeout = 3600                             # Snapshot creation timeout (seconds)
delete_snap_task_timeout = 3600                             # Snapshot deletion timeout (seconds)
local_host_ip = ""                                          # Local host IP (optional)
max_socket_connections_per_host = 8                         # Max connections per host
max_writer_num = 10                                         # Max writer threads
Linux Agent Operations Maintenance
Runtime Environment
By deploying the Agent program on the source server, the system can capture real-time changes in the file system or block devices to achieve continuous data synchronization. This is suitable for physical servers, non-virtualized environments, or scenarios requiring more granular control.
Linux Agent supports deployment on the following Linux operating systems: CentOS 6.5+, CentOS 7.x/8.x, RHEL 6.x/7.x/8.x, SLES 11 SP1/SP3/SP4, and Ubuntu Server 12.04/14.04/16.04/18.04/20.04 (all 64-bit).
The system is installed in the /var/lib/egisplus-agent directory. The main files and directory structure are as follows:
egisplus-agent/
├── agent-sync.db              # Local sync database, stores agent sync status
├── agent-sync.db-shm          # SQLite shared memory file
├── agent-sync.db-wal          # SQLite write-ahead log file
├── collect_system_info.sh     # Script to collect system information
├── config.ini                 # Main configuration file (service address, authentication, etc.)
├── disk_uuid_map              # Mapping between disk UUID and device path
├── egisplus-agent             # Main executable (agent core)
├── egisplus_version           # Agent version information
├── fstab.bak                  # Backup of `/etc/fstab` (mount point info)
├── hw_serial                  # Host hardware serial number (for unique identification)
├── protect_type               # Protection type definition (e.g., full, incremental)
├── public_key                 # Public key for communication with the server
├── registered                 # Registration flag (usually an empty file means registered)
├── uninstall_agent.sh         # Uninstall script to clean up installation and config
├── upgrade_agent.sh           # Upgrade script for updating agent version
└── version                    # Version file, indicates current running version
Service Health Status
After installing the Linux Agent, use the egisplus-cli tool for operation and management. Operations staff can use related commands to check service status and perform control operations.
Command structure:
egisplus-cli agent <subcommand>

Subcommand      Description
check           Check agent status, health or running status
clean           Clean certain caches or temporary data
cow             Copy-On-Write related operations
devices         Show or manage devices (disks, partitions, etc.)
fs              File system operations (mount, check, etc.)
log             View agent-related logs
read_rate       View or set read rate limits
version         Show `egisplus-cli` tool version
Example of checking agent status:
egisplus-cli agent checkThe output shows the status check result of the egisplus-cli program:
Service status
    Agent service is started: Yes.                        ##Agent service is running
    iSCSI service is started: Yes.                        ##iSCSI service is also running, indicating this node may be used for block storage or backup mounting
Agent status
    This agent is registered: Yes.                        ##This agent has been successfully registered to HyperBDR
    This agent is protected : No.                         ##No means data sync has not started yet
    Heartbeat of this agent : 305.                        ##Agent has heartbeat connection with the controller, value indicates normal connection
File system
    block       mount   fs      free    used    path
    /dev/dm-0   /       xfs     185G    4%      /dev/mapper/centos-root    ##Current system mounted disks and usage
    /dev/sda1   /boot   xfs     853M    16%     /dev/sda1                  ##Current system mounted disks and usage
Service Start/Stop/Restart
Operations staff can use systemd to manage the egisplus-agent.service with the following commands:
Start service
systemctl start egisplus-agent.serviceStop service
systemctl stop egisplus-agent.serviceRestart service
systemctl restart egisplus-agent.service
Log Management
All system log files are stored in the /var/log/egisplus-agent directory. Operations staff can view log files to monitor system status, troubleshoot issues, or provide relevant files to project managers to ensure system stability.
egisplus-agent/
├── agent-syncer.log              # Log for sync tasks with control center/cloud
├── agent-syncer-panic.log        # Exception/crash log for sync tasks, primary for troubleshooting
├── db.log                        # Log for local state database or metadata operations
├── linux_agent.log               # Core runtime log for the main agent program, records service start, registration, scheduling, etc.
└── linux_agent.log-20250511.gz   # Rotated historical log, gzip compressed
Log Collection
In the HyperBDR system, operations personnel can collect and download the required log files from the “Operations > Download Logs > DR | Failback > Linux Hosts” page according to their needs, facilitating issue troubleshooting and system monitoring.
Select the target host and click the "Collect" button in the corresponding row.
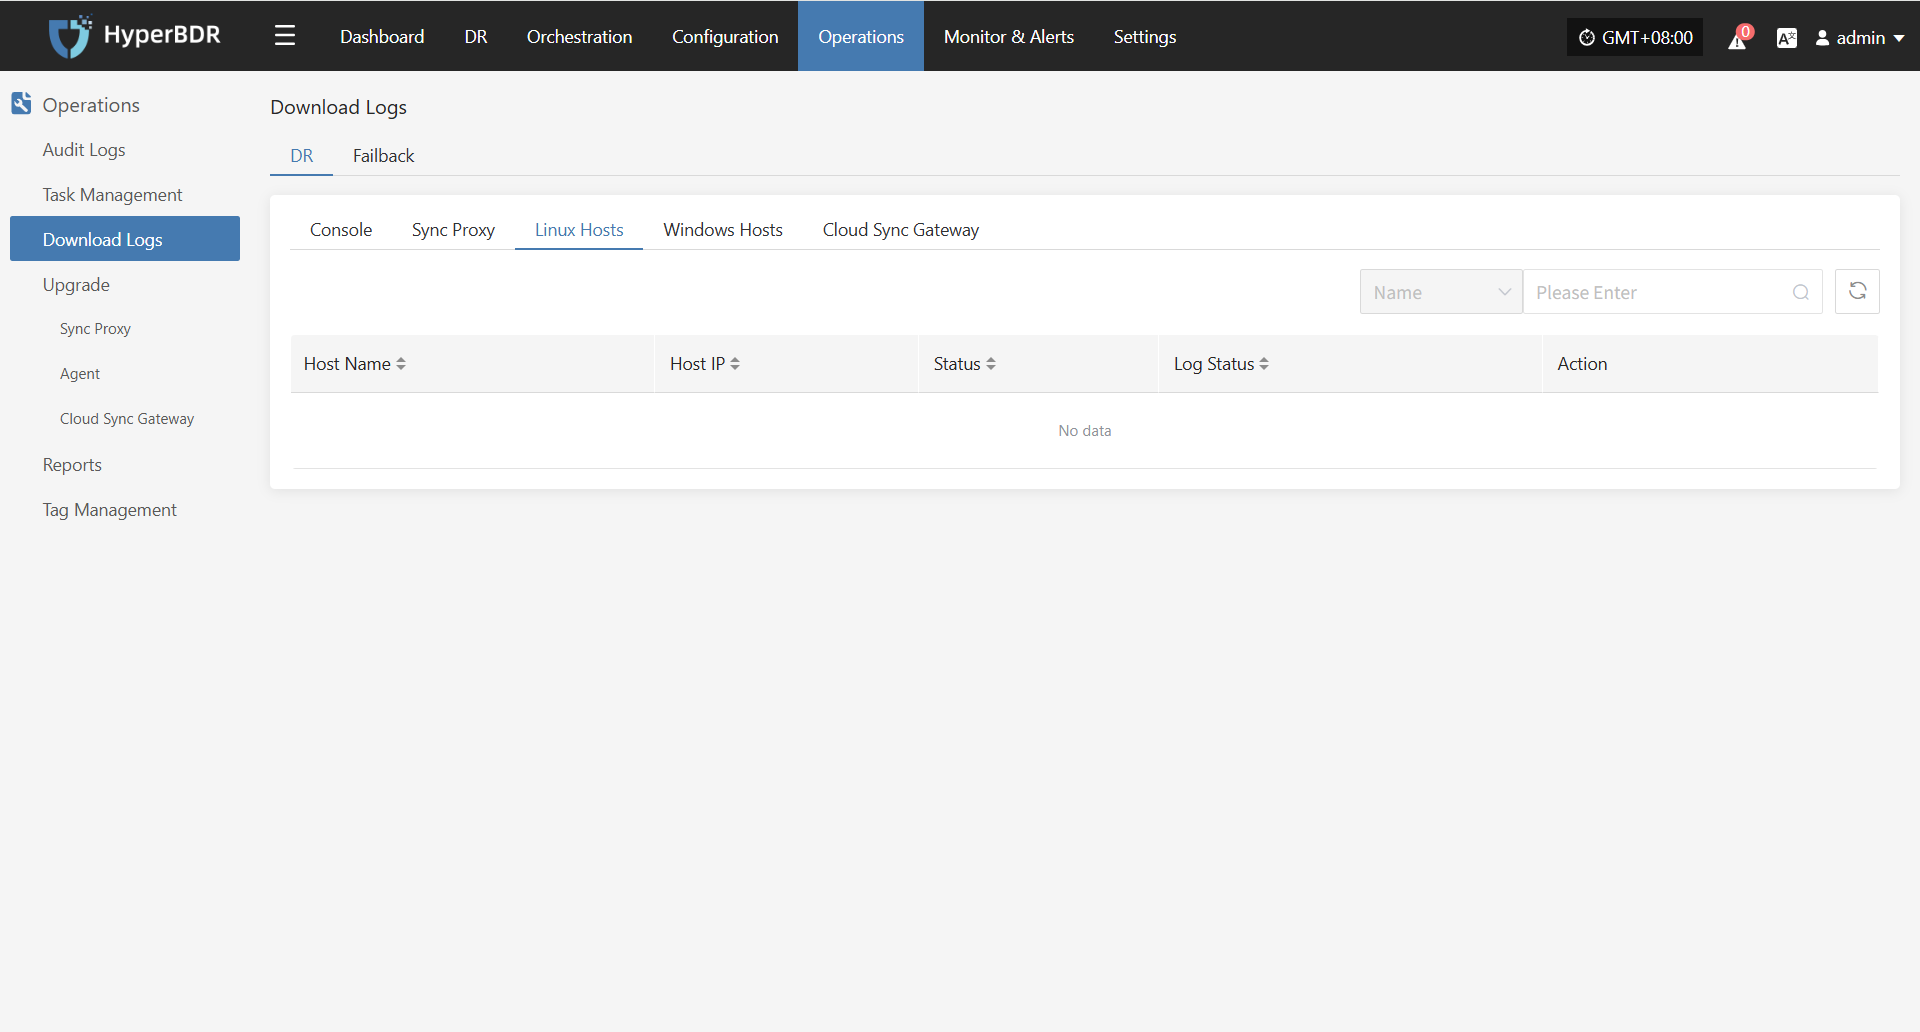
Select Time Range
In the pop-up dialog, set the time range for the logs you want to collect. After confirming, the system will automatically start collecting logs.
Start Collection
After confirming the time range, the system will automatically start collecting logs, and the log status will change to "Collecting".
Download Logs
After log collection is complete, the status will update to "Available". Users can click "Click for list" to see the log files and select files to download.
Configuration File Management
The main configuration file for Linux Agent is located in /var/lib/egisplus-agent and named config.ini. This file contains all configuration information for the Linux Agent, including service connections, database, sync tasks, logs, S3 settings, and more.
Below are the main sections of the configuration file and their descriptions:
[INFO]
Version = 6.1.0
### Application version

[DEFAULT]
ServerAddress = 127.0.0.1:19982       # Service listen address and port
ServerCertFile =                      # Server SSL certificate file path (optional)
ServerKeyFile =                       # Server SSL key file path (optional)
ReadTimeout = 20                      # Request read timeout (seconds)
WriteTimeout = 20                     # Response write timeout (seconds)
StopTimeout = 10                      # Wait timeout before service stops (seconds)
MaxHeaderBytes = 1048576              # Max HTTP request header size (bytes)

[DATABASE]
DatabaseFile = /var/lib/egisplus-agent/agent-sync.db  # SQLite database file path
DBLogFile = /var/log/egisplus-agent/db.log            # Database operation log path

[SYNC]
Deduplicate = true                    # Enable deduplication
Compress = ""                         # Data compression method (empty means disabled)
Encrypt = ""                          # Data encryption method (empty means disabled)
IndexPath = /var/lib/egisplus-agent/index  # Index data storage path
DirectIO = false                      # Enable Direct I/O
WorkersPerBlock = 2                   # Number of processing threads per data block
BuffersPerBlock = 8                   # Number of buffers per data block
SaveIndexInterval = 30                # Index save interval (seconds)
SaveBlobInterval = 10                 # Blob data save interval (seconds)
ConcurrentThreads = 2                 # Number of concurrent sync threads
SyncBufferSize = 8                    # Sync buffer size
EnableRetry = true                    # Enable retry on failure
RetryCount = 10                       # Max retry count
RetryInterval = 30                    # Retry interval (seconds)
CheckDup = true                       # Check for duplicate data

[S3]
AccessKey = ak                        # S3 access key
SecretKey = sk                        # S3 secret key
Region = region                       # S3 region
BucketName = bucket                   # S3 bucket name
StorageClass = standard               # Storage class (e.g., standard, infrequent-access)
URL = https://                        # S3 service address
UseTLS = true                         # Enable TLS connection

[CLIENT]
ClientCertFile = /var/lib/egisplus-agent/client_cert_file  # Client certificate file path
ClientKeyFile = /var/lib/egisplus-agent/client_key_file    # Client key file path
ClientUploadURL = 120               # Client upload URL timeout (seconds)
ClientTimeout = 120                 # Client request timeout (seconds)
SendContentMd5 = true               # Send Content-MD5 header
DisableContentSha256 = true         # Disable Content-SHA256 check

[LOG]
LogPath = /var/log/egisplus-agent   # Log file path
LogFileName = agent-syncer.log      # Log file name
LogLevel = info                     # Log level (e.g., debug, info, warn, error)
LogFileMaxSize = 64                 # Max size per log file (MB)
LogFileMaxBackups = 10              # Number of historical log files to keep
LogMaxAge = 28                      # Max log retention days
LogCompress = true                  # Compress historical logs
LogStdout = false                   # Output logs to console
Windows Agent Operations Maintenance
Runtime Environment
By deploying the Agent program on the source server, the system can capture real-time changes in the file system or block devices to achieve continuous data synchronization. This is suitable for physical servers, non-virtualized environments, or scenarios requiring more granular control.
Windows Agent supports deployment on the following Windows Server operating systems: 2003 SP2/R2, 2008, 2008 R2, 2012, 2012 R2, 2016, 2019 (all 64-bit).
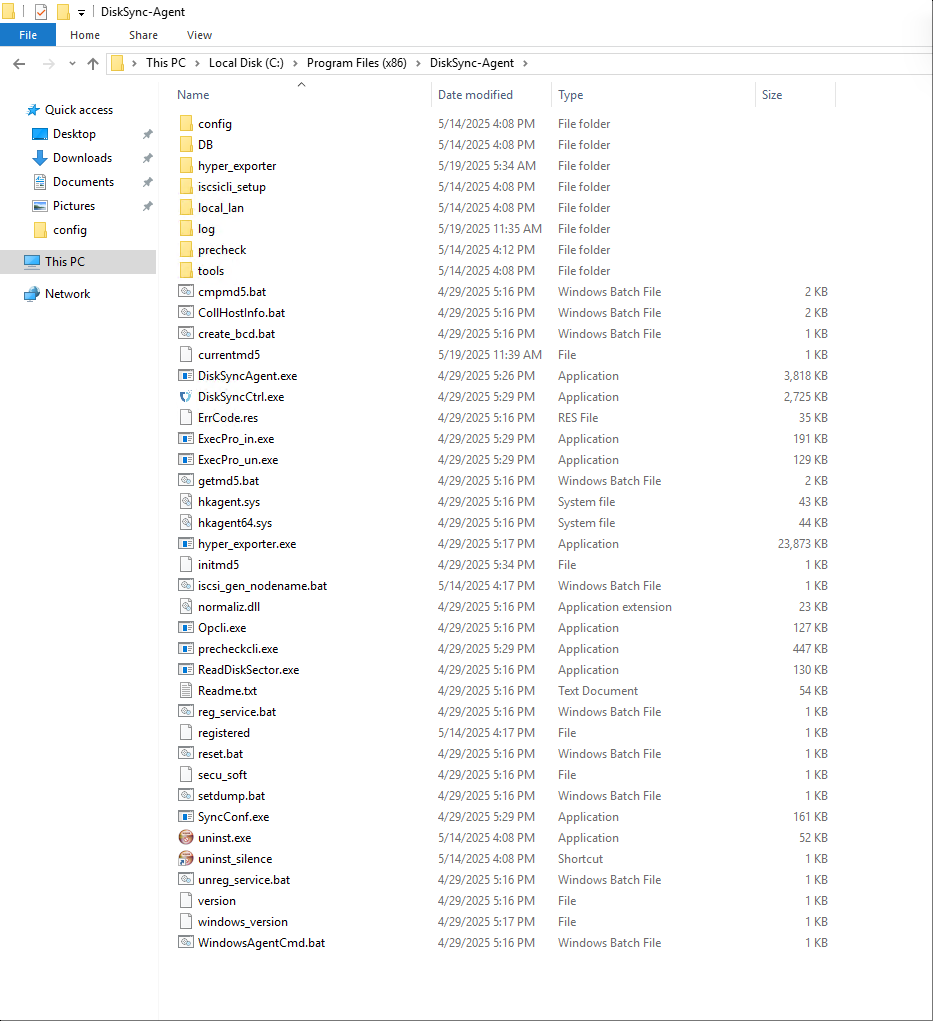
The system is installed in the C:\Program Files (x86)\DiskSync-Agent directory (the actual path depends on your installation choice). The main files and directory structure are as follows:
Service Health Status
Operations staff can check the service status using Windows Task Manager to confirm whether the service is running properly.
Ways to open Task Manager:
Method 1:
Press <Ctrl + Alt + Del> on your keyboard at the same time.Method 2:
Press Win + R to open the Run dialog.
Enter taskmgr and press Enter.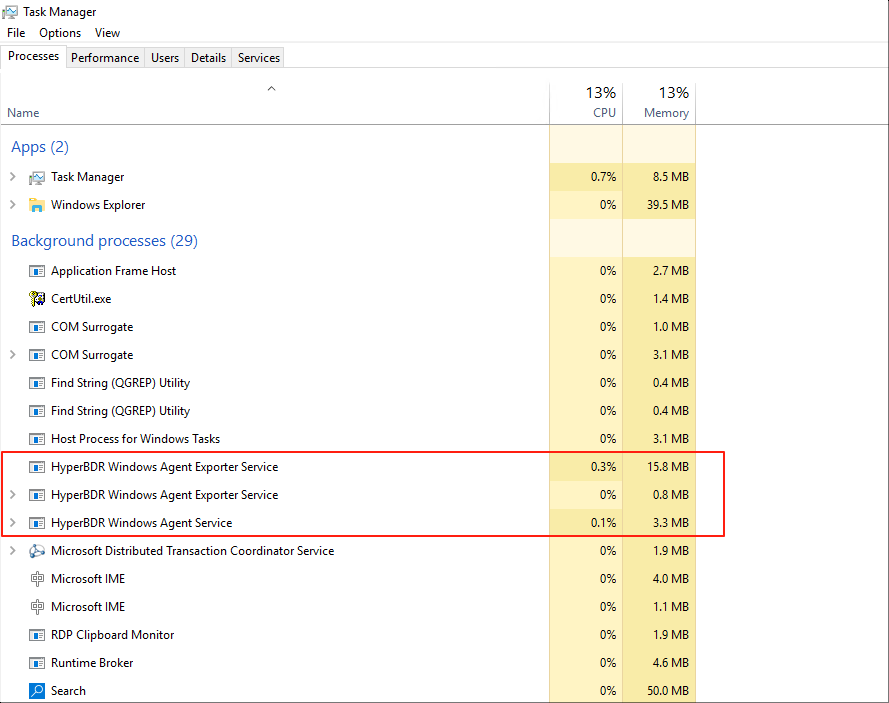
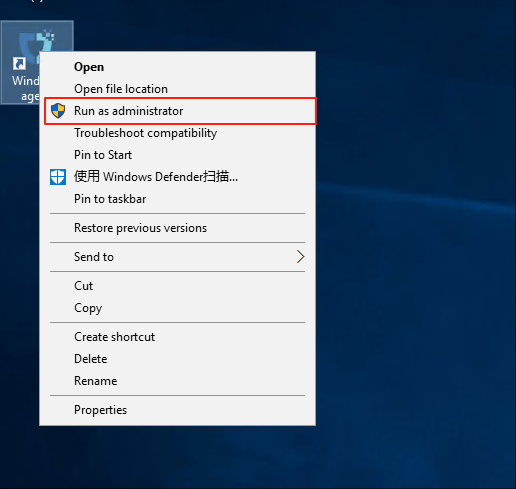
Service Start/Stop/Restart
Start Service:
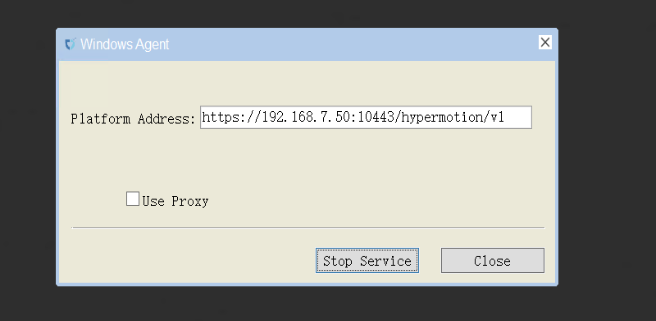
- Right-click the Windows Agent shortcut on the desktop and run as administrator.
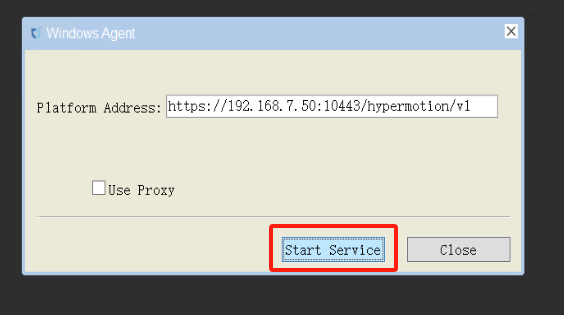
- Left-click "Start Service".
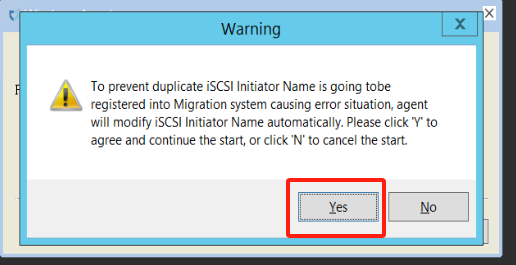
- Warning message (can be ignored).
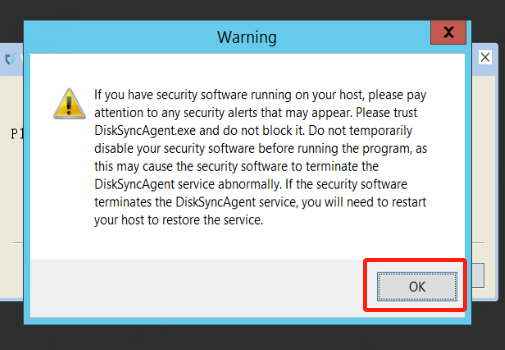
- Service started successfully.

Stop Service:
- Click "Stop Service" to stop the service.
Log Management
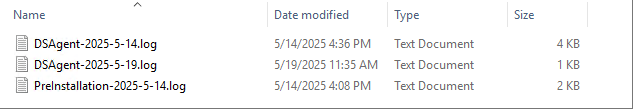
All system log files are stored in the C:\Program Files (x86)\DiskSync-Agent\log directory (the actual path depends on your installation choice). Operations staff can view log files to monitor system status, troubleshoot issues, or provide relevant files to project managers to ensure system stability.
Log Collection
In the HyperBDR system, operations personnel can collect and download the required log files from the “Operations > Download Logs > DR | Failback > Windows Hosts” page according to their needs, facilitating issue troubleshooting and system monitoring.
Select the target host and click the "Collect" button in the corresponding row.

Select Time Range
In the pop-up dialog, set the time range for the logs you want to collect. After confirming, the system will automatically start collecting logs.
Start Collection
After confirming the time range, the system will automatically start collecting logs, and the log status will change to "Collecting".
Download Logs
After log collection is complete, the status will update to "Available". Users can click "Click for list" to see the log files and select files to download.
Configuration File Management
The main configuration file for Windows Agent is located in the C:\Program Files (x86)\DiskSync-Agent\config directory (the actual path depends on your installation choice), and the file name is Sysconfig.ini. This file contains all configuration information for the Windows Agent, including service connections, database, sync tasks, logs, S3 settings, and more.
Below are the main sections of the configuration file and their descriptions:
[SysParam]
HM_URL =https://192.168.7.141:10443/hypermotion/v1
SYNC_NODE_KEY =da8aae5b-facb-452f-8161-5c866f8fafaa

;log level
LOGFLAG=2

;Filename of successful host registration
REG_FILE=registered

;Heartbeat interval (seconds)
HEARTBEAT_INTERVAL=50

;Whether to modify the iscsi initiator name tag, 1: modify; 0: not modify.
MODIFY_INITIATOR=1

;Used for the blobsize in iSCSI mode under non-VSS mode
COPYSIZE=3

;Proportion of cache files in partition capacity under non-VSS mode.
SWAPESPACE_PERCENT=10

;Whether to adopt the vss mode: 1. vss mode; 0. normal mode.
VSS_MODEL=1

;The proportion of volume shadow storage on the disk in VSS mode.
VSS_MAX_SIZE_PERCENT=10

;Configuration of volume shadow storage for special volumes in VSS mode, which can be configured for multiple volumes: size (G)
;VSS_SPEC_MAX_C=c:10

;The minimum proportion of free space in the volume.
FREELIMIT_PERCENT=3

apply_scene=dr

; 0: Retry after an error occurs during the synchronization process, with the retry time referring to ERRRETRY_DURATION; 1: Return an error immediately upon a synchronization error.
ERRORRETURN=0

;Maximum retry duration (in seconds) after a synchronization error.
ERRRETRY_DURATION=600

;Maximum number of blobs for hook in non-VSS mode.
HOOKBUFF_BLOCKCOUNT_MAX=256

;Minimum number of blobs for hook in non-VSS mode.
HOOKBUFF_BLOCKCOUNT_MIN=64

; 1: Write the first sector to the target disk, 0: Do not write the first sector to the target disk.
WRITE_FIRST_SECTOR=0

;Maximum number of write threads in object storage mode.
THREAD_COUNT=4

;thread interval(millisecond)
THREAD_INTERVAL=25

;Whether to send the metafile (including the local metafile) to the object storage.
WRITE_OSS_META=0

;The maximum CPU usage allowed for the process. The actual CPU usage of the process may fluctuate up and down, and online update is supported.
CPU_USEAGE_SETTING=30

;Specify the disks that do not require synchronization. When there are multiple disks, separate the disk numbers with commas. For example: EXCLUDE_DISKS=1,2. The default is EXCLUDE_DISKS=NULL, which synchronizes all disks.
EXCLUDE_DISKS=NULL

;iscsi service parameters
MaxRequestHoldTime=120
SrbTimeoutDelta=120
LinkDownTime=15
InitialR2T=1
ImmediateData=0
FirstBurstLength=16384
MaxBurstLength=16384
MaxRecvDataSegmentLength=8192

ISCSI_SYNC_STATUS=0
ISCSI_PROTECT_STATUS=0
hyper_exporter_id=c85eb10e1a8f4dd58080d9cbe0d71bf4
LOCAL_LAN=1
use_proxy=0
VSS_CHECK_RESULT=1
Cloud Sync Gateway Operations Maintenance
Runtime Environment
The Cloud Sync Gateway is a key component that connects the source and target cloud platforms. It is responsible for receiving and processing both full and incremental data from the source, synchronizing it to the cloud platform's storage, and enabling efficient, cost-effective data backup and disaster recovery.
The platform automatically creates a default Cloud Sync Gateway environment, typically using Ubuntu 24.04 with 4 CPU cores, 8GB RAM, and a 50GB disk.
The system is installed in the /var/lib/sgateway directory (location is configurable). The main files and directory structure are as follows:
/var/lib/sgateway/
├── certs                   # Directory for TLS/SSL certificates (including private/public keys)
├── config                  # Directory for configuration files (e.g., s3block_config.ini)
├── confmgmt                # Configuration management directory, possibly for centralized config or version control
├── diskdir                 # Local data directory, used for object storage data or cache
├── dr                      # Disaster Recovery related directory (may be empty or reserved)
├── logs                    # Log directory, stores s3block and watchman logs
├── s3block                 # s3block main executable, provides core data services
├── s3block.db              # s3block local database file, stores task status, metadata, etc.
├── s3block.service         # systemd service file for managing s3block startup and operation
├── s3block_version         # s3block version information file
├── version                 # System or module version identifier file
├── watchman                # watchman main executable, responsible for monitoring and sync triggers
└── watchman.service        # systemd service file for managing watchman startup and operation
Service Health Status
After the Cloud Sync Gateway is installed, it is managed and operated via systemd. Operations staff can use systemctl commands to check service status and perform control operations. The Cloud Sync Gateway requires attention to three services: s3block.service, watchman.service, and hyper_exporter.service.
| Service | Status Field | Service Status |
|---|---|---|
| s3block.service | Active | active (running) |
| watchman.service | Active | active (running) |
| hyper_exporter.service | Active | active (running) |
Check service status with systemctl status <service-name>. Any status other than active is abnormal and requires further troubleshooting. Example:
systemctl status s3block.serviceService Start/Stop/Restart
Operations staff can use systemd to manage s3block.service and watchman.service with the following commands:
Start Service
s3block.servicesystemctl start s3block.servicewatchman.servicesystemctl start watchman.service
Stop Service
s3block.servicesystemctl stop s3block.servicewatchman.servicesystemctl stop watchman.service
Restart Service
s3block.servicesystemctl restart s3block.servicewatchman.servicesystemctl restart watchman.service
Log Management
All system log files are stored in the /var/log/sgateway directory. Operations staff can check log files to monitor system status, troubleshoot issues, or provide relevant files to project managers to ensure system stability.
/var/log/sgateway/
├── s3block_20250514.log       # s3block log for 2025-05-14
├── s3block_20250515.log       # s3block log for 2025-05-15
├── watchman_20250514.log      # watchman log for 2025-05-14
└── watchman_20250515.log      # watchman log for 2025-05-15
Log Collection
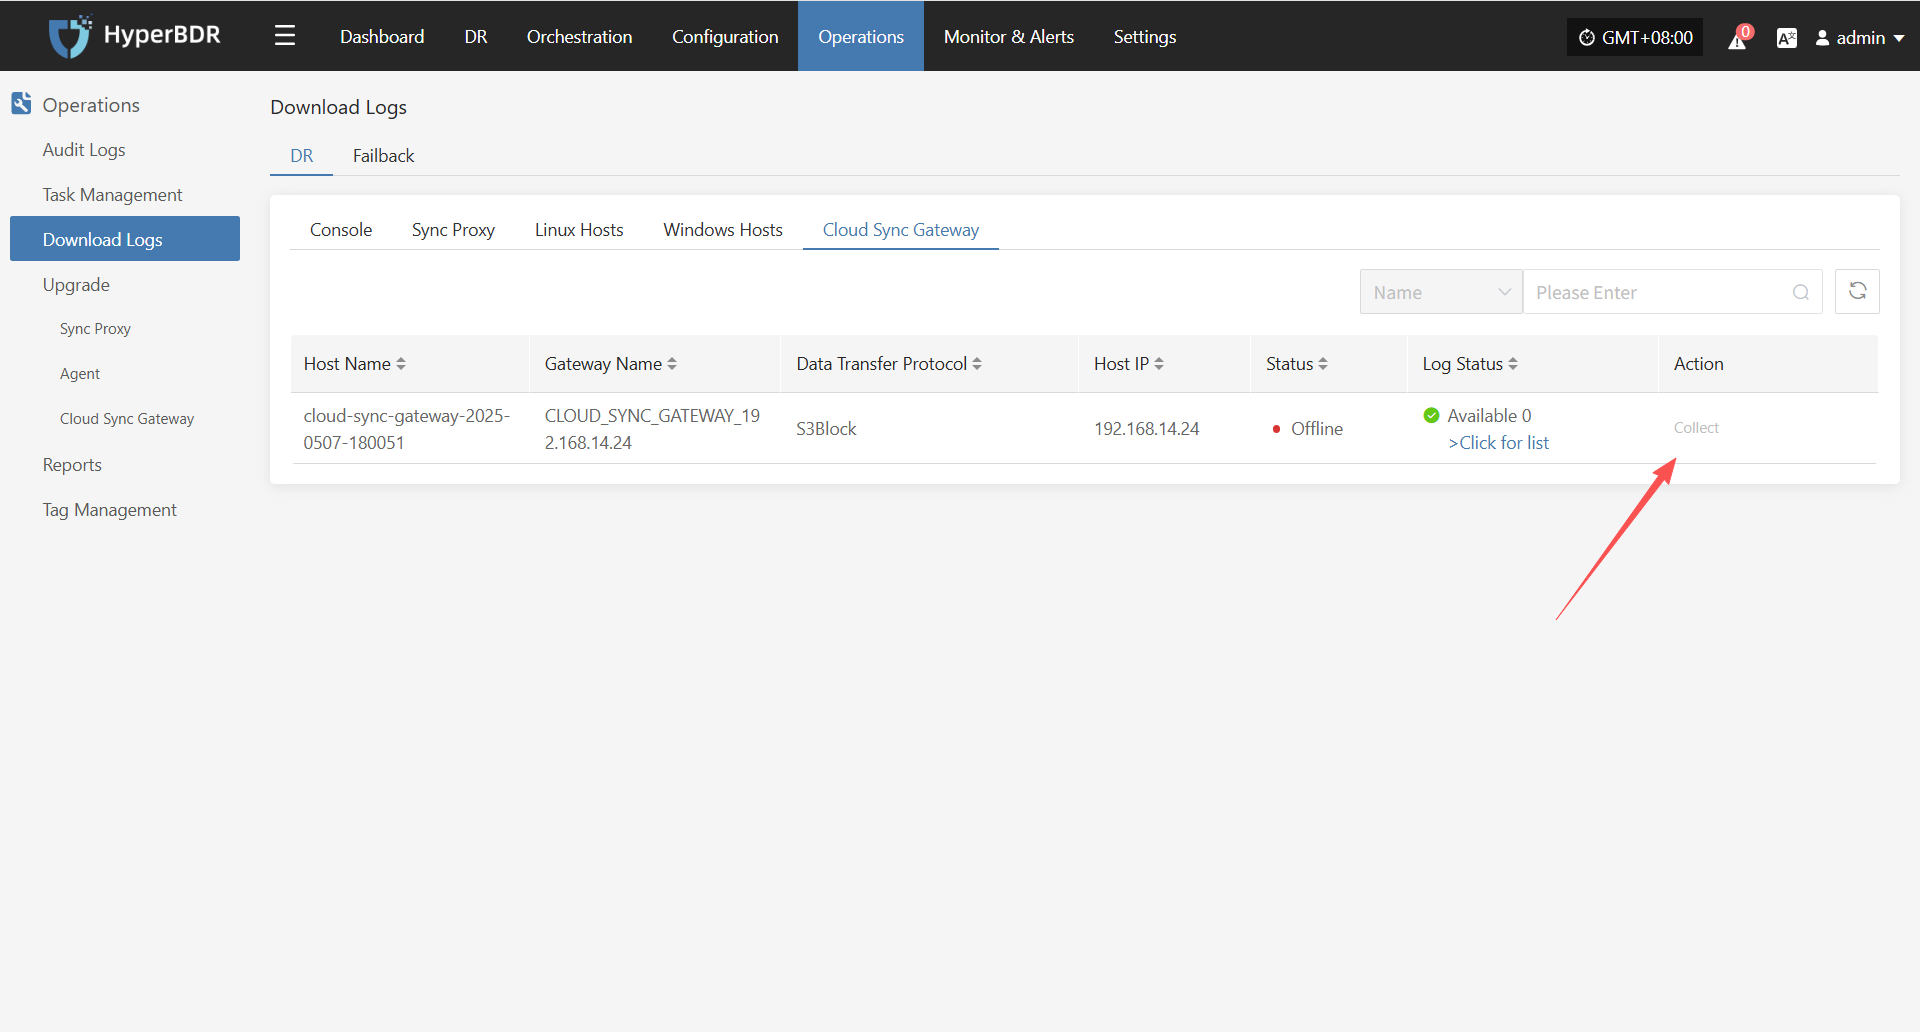
In the HyperBDR system, operations personnel can collect and download the required log files from the “Operations > Download Logs > DR | Failback > Cloud Sync Gateway” page according to their needs, facilitating issue troubleshooting and system monitoring.
Select the target host and click the "Collect" button in the corresponding row.
Select Time Range
In the pop-up dialog, set the time range for the logs you want to collect. After confirming, the system will automatically start collecting logs.
Start Collection
After confirming the time range, the system will automatically start collecting logs, and the log status will change to "Collecting".
Download Logs
After log collection is complete, the status will update to "Available". Users can click "Click for list" to see the log files and select files to download.
Configuration File Management
The main configuration file for the Cloud Sync Gateway is s3block_config.ini, located in the /var/lib/sgateway/config directory. This file contains key information such as gateway ID, public IP, WebSocket service address, local data directory, log level, S3 storage credentials, endpoint address, and more, supporting data sync and communication between the gateway and central services.
Below are the main sections of the configuration file and their descriptions:
[system]
gateway_uuid     = 41f2ef9e-50c7-430f-b316-e9e4ec5516d4     # Unique gateway identifier (UUID)
websocket_server = wss://192.168.7.141:10443/duplex/gateway/v1  # WebSocket address for bidirectional communication with the server
filedir          = diskdir                                 # Local data storage directory (relative path)
log_level        = 1                                       # Log level (1 means INFO)
multi_srv        = true                                    # Enable multi-service mode (true means enabled)
public_ip        = 192.168.14.65                           # Public IP address for gateway communication
accessKey        = wCi7qC8RlFydraCugWWa                    # Object storage access key
secretAccessKey  = TH5g4gbJKsK2YEsBLj7GaFpbWTiGYarRQSu1B59t # Object storage secret key
localdisksaved   =                                         # Local disk persistence directory (empty means default)
endpoint         = https://192.168.14.65:13260             # Object storage endpoint (API address)
bucketcreated    = true                                    # Whether the bucket is created (true means created)
Temporary Transition Host Image Operations Maintenance
Runtime Environment
The "Temporary Transition Host Image" is used to quickly create a temporary cloud host image for scenarios such as system migration, disaster recovery, or testing and validation, ensuring smooth business transition. When creating, the configuration should match the failback host.
Upgrade Management
Console
The Console supports online upgrades, with a smooth process that preserves configuration files and data, suitable for daily version maintenance, feature enhancements, and issue fixes, ensuring continuous and stable operation of the system.
Upgrade Preparation
Overall Upgrade
Before starting the operation, please be sure to contact the project owner or directly visit the official OnePro online docs website to obtain the latest installation package to complete the subsequent upgrade.Click to Get Installation Package
Upload the installation package to the server
Unzip to the specified directory, for example:
tar -zxvf <update-package>.tar.gz -C /pathSingle module upgrade
Before starting, please contact the project owner to obtain the latest module package to complete subsequent upgrade operations.
Upload the installation package to the server
Create update package directory
mkdir -p /root/upgrade_$(date +%Y%m%d)- Upload the update package to the newly created directory
Execute Upgrade
Overall Upgrade
- Execute the upgrade command, and the system will automatically load the update content into the running directory
/opt/installer/production/venvs:
cd /opt/installer/production/scripts
./hmctl upgrade /path/installer/venvs
Single module upgrade
- Execute the upgrade command, and the system will automatically load the update content into the running directory
/opt/installer/production/venvs:
cd /opt/installer/production/scripts
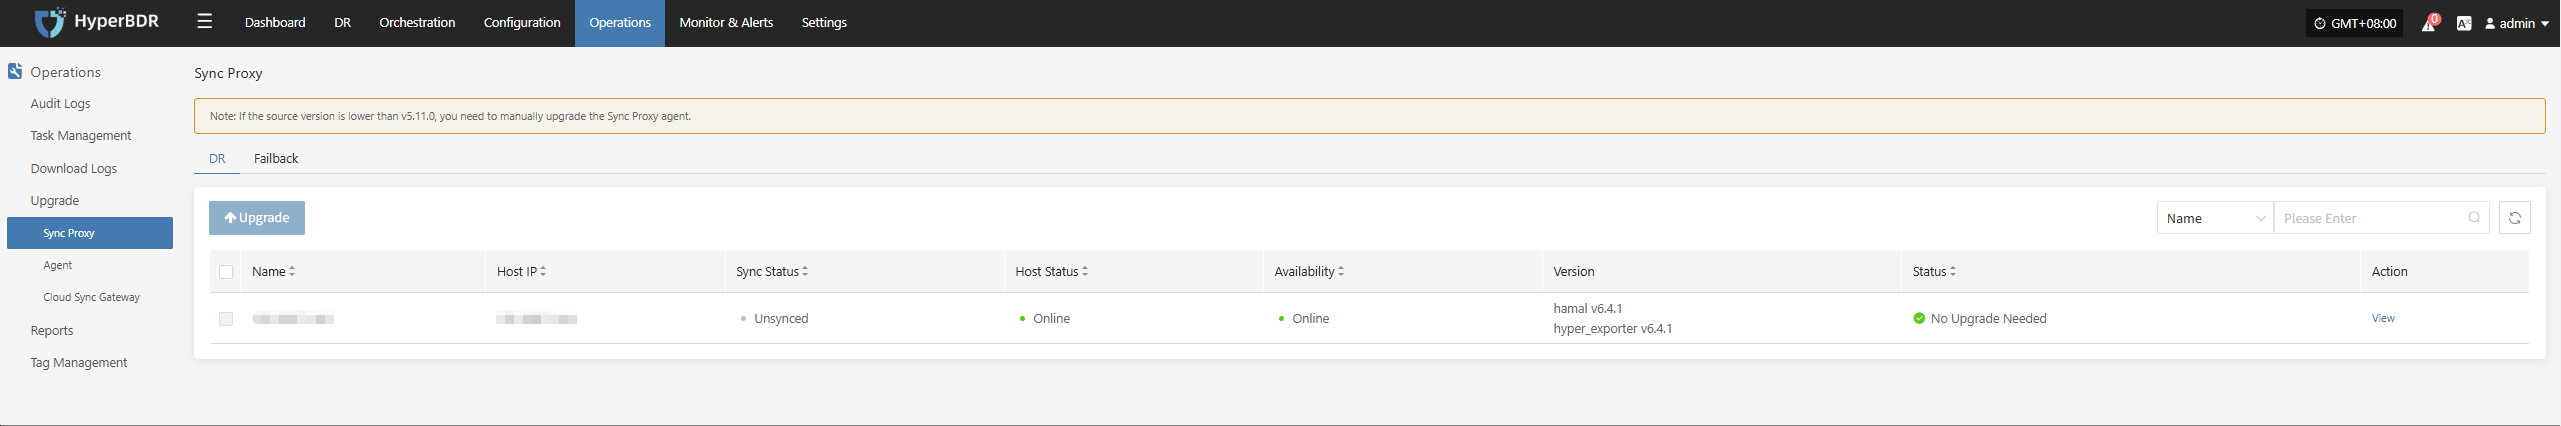
./hmctl upgrade /root/upgrade_$(date +%Y%m%d)/Sync Proxy
Upgrade Preparation
The system supports component upgrades through the platform's web interface. The upgrade process is smooth and preserves all configurations, making it suitable for routine version maintenance and feature updates.
During the component upgrade process, you also need to complete the above-mentioned upgrade package preparation and deployment steps.
Upgrade Operation
Users can access the platform login page via a web browser and authenticate with a valid username and password. Once logged in, you can perform the online upgrade.
Operations & Maintenance Management -- Upgrade Management -- Source Sync Proxy
After completing steps 1 and 2, you will see an upgrade prompt at the corresponding location.
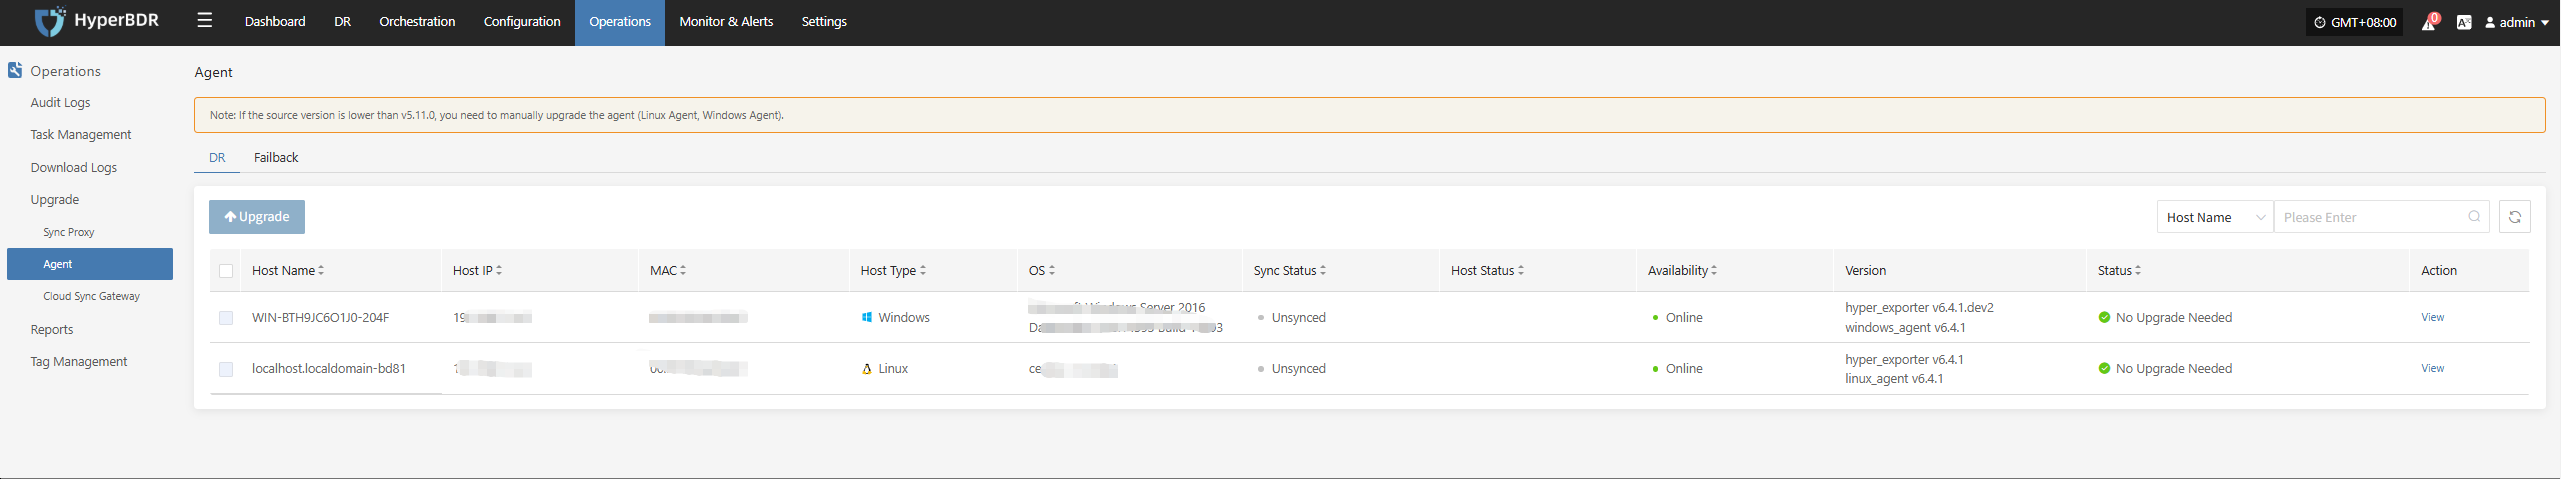
Linux Agent
Upgrade Preparation
The system supports component upgrades through the platform's web interface. The upgrade process is smooth and preserves all configurations, making it suitable for routine version maintenance and feature updates.
During the component upgrade process, you also need to complete the above-mentioned upgrade package preparation and deployment steps.
Upgrade Operation
Users can access the platform login page via a web browser and authenticate with a valid username and password. Once logged in, you can perform the online upgrade.
Operations & Maintenance Management -- Upgrade Management -- Source Agent
After completing steps 1 and 2, you will see an upgrade prompt at the corresponding location.

Windows Agent
Upgrade Preparation
The system supports component upgrades through the platform's web interface. The upgrade process is smooth and preserves all configurations, making it suitable for routine version maintenance and feature updates.
During the component upgrade process, you also need to complete the above-mentioned upgrade package preparation and deployment steps.
Upgrade Operation
Users can access the platform login page via a web browser and authenticate with a valid username and password. Once logged in, you can perform the online upgrade.
Operations & Maintenance Management -- Upgrade Management -- Source Agent
After completing steps 1 and 2, you will see an upgrade prompt at the corresponding location.
Cloud Sync Gateway
Upgrade Preparation
The system supports component upgrades through the platform's web interface. The upgrade process is smooth and preserves all configurations, making it suitable for routine version maintenance and feature updates.
During the component upgrade process, you also need to complete the above-mentioned upgrade package preparation and deployment steps.
Upgrade Operation
Users can access the platform login page via a web browser and authenticate with a valid username and password. Once logged in, you can perform the online upgrade.
Operations & Maintenance Management -- Upgrade Management -- Cloud Sync Gateway
After completing steps 1 and 2, you will see an upgrade prompt at the corresponding location.

Transition Host Image
Upgrade Preparation
The system supports component upgrades through the platform's web interface. The upgrade process is smooth and preserves all configurations, making it suitable for routine version maintenance and feature updates.
During the component upgrade process, you also need to complete the above-mentioned upgrade package preparation and deployment steps.
Upgrade Operation
Users can access the platform login page via a web browser and authenticate with a valid username and password. Once logged in, you can perform the online upgrade.
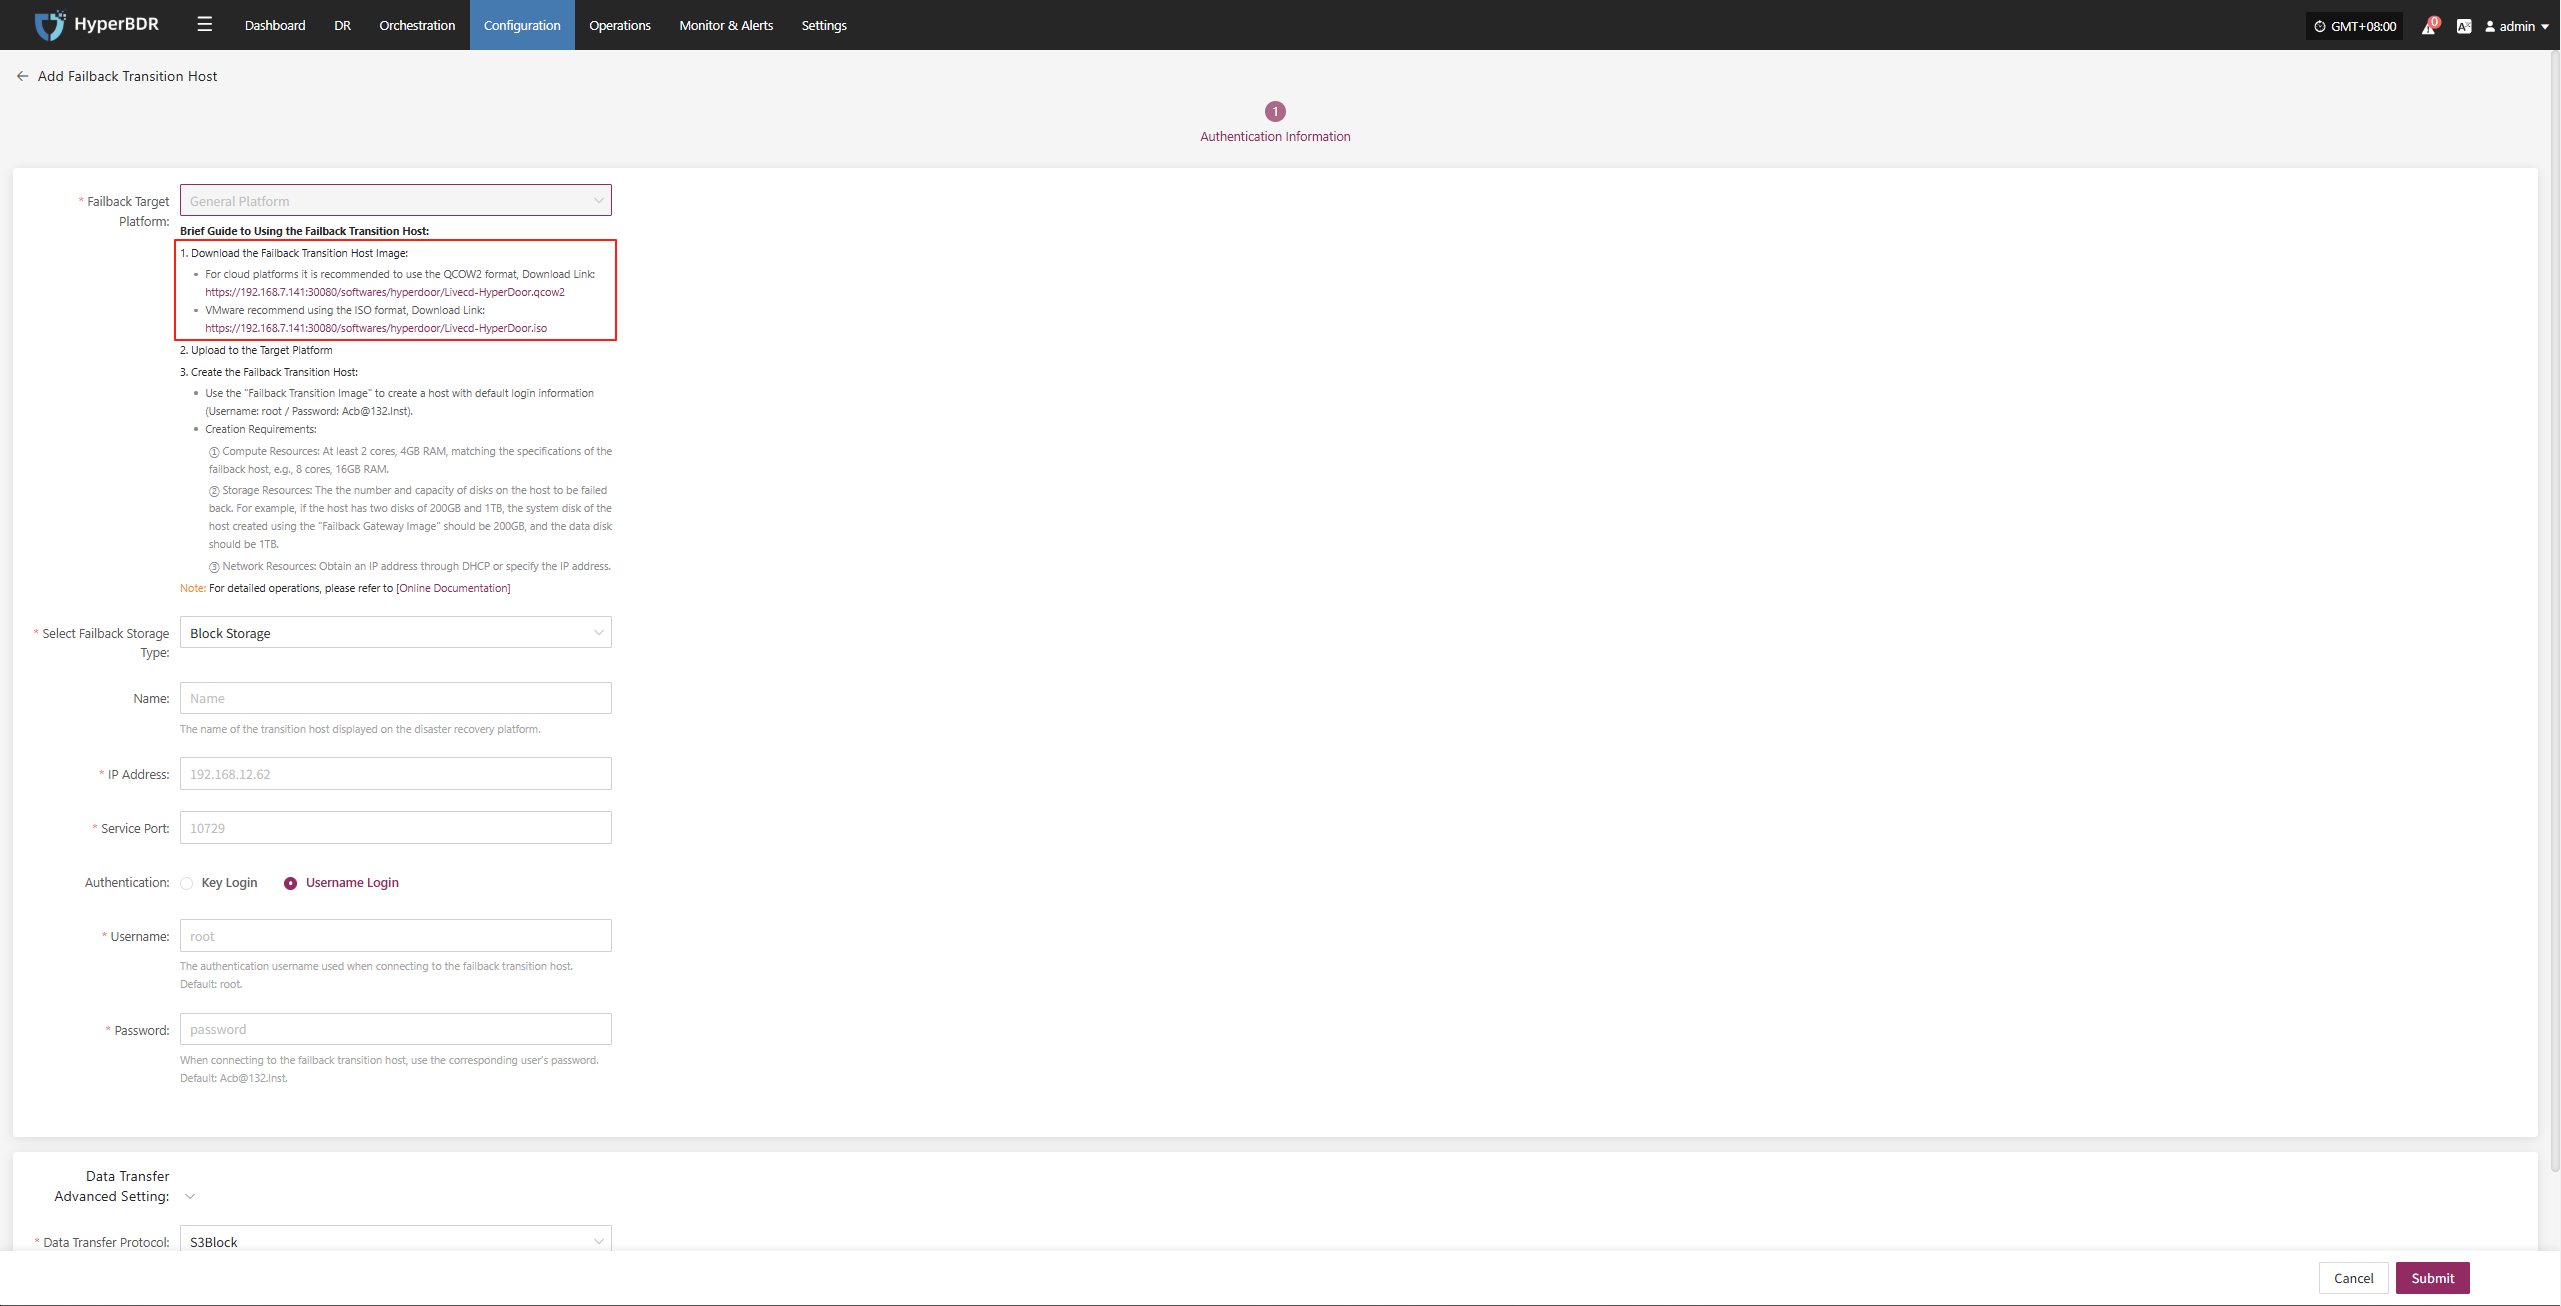
Due to the special nature of the transition host, reconfiguration is required during the upgrade.
Configuration Management -- Disaster Recovery Platform Configuration -- General Mode -- Failback -- Add
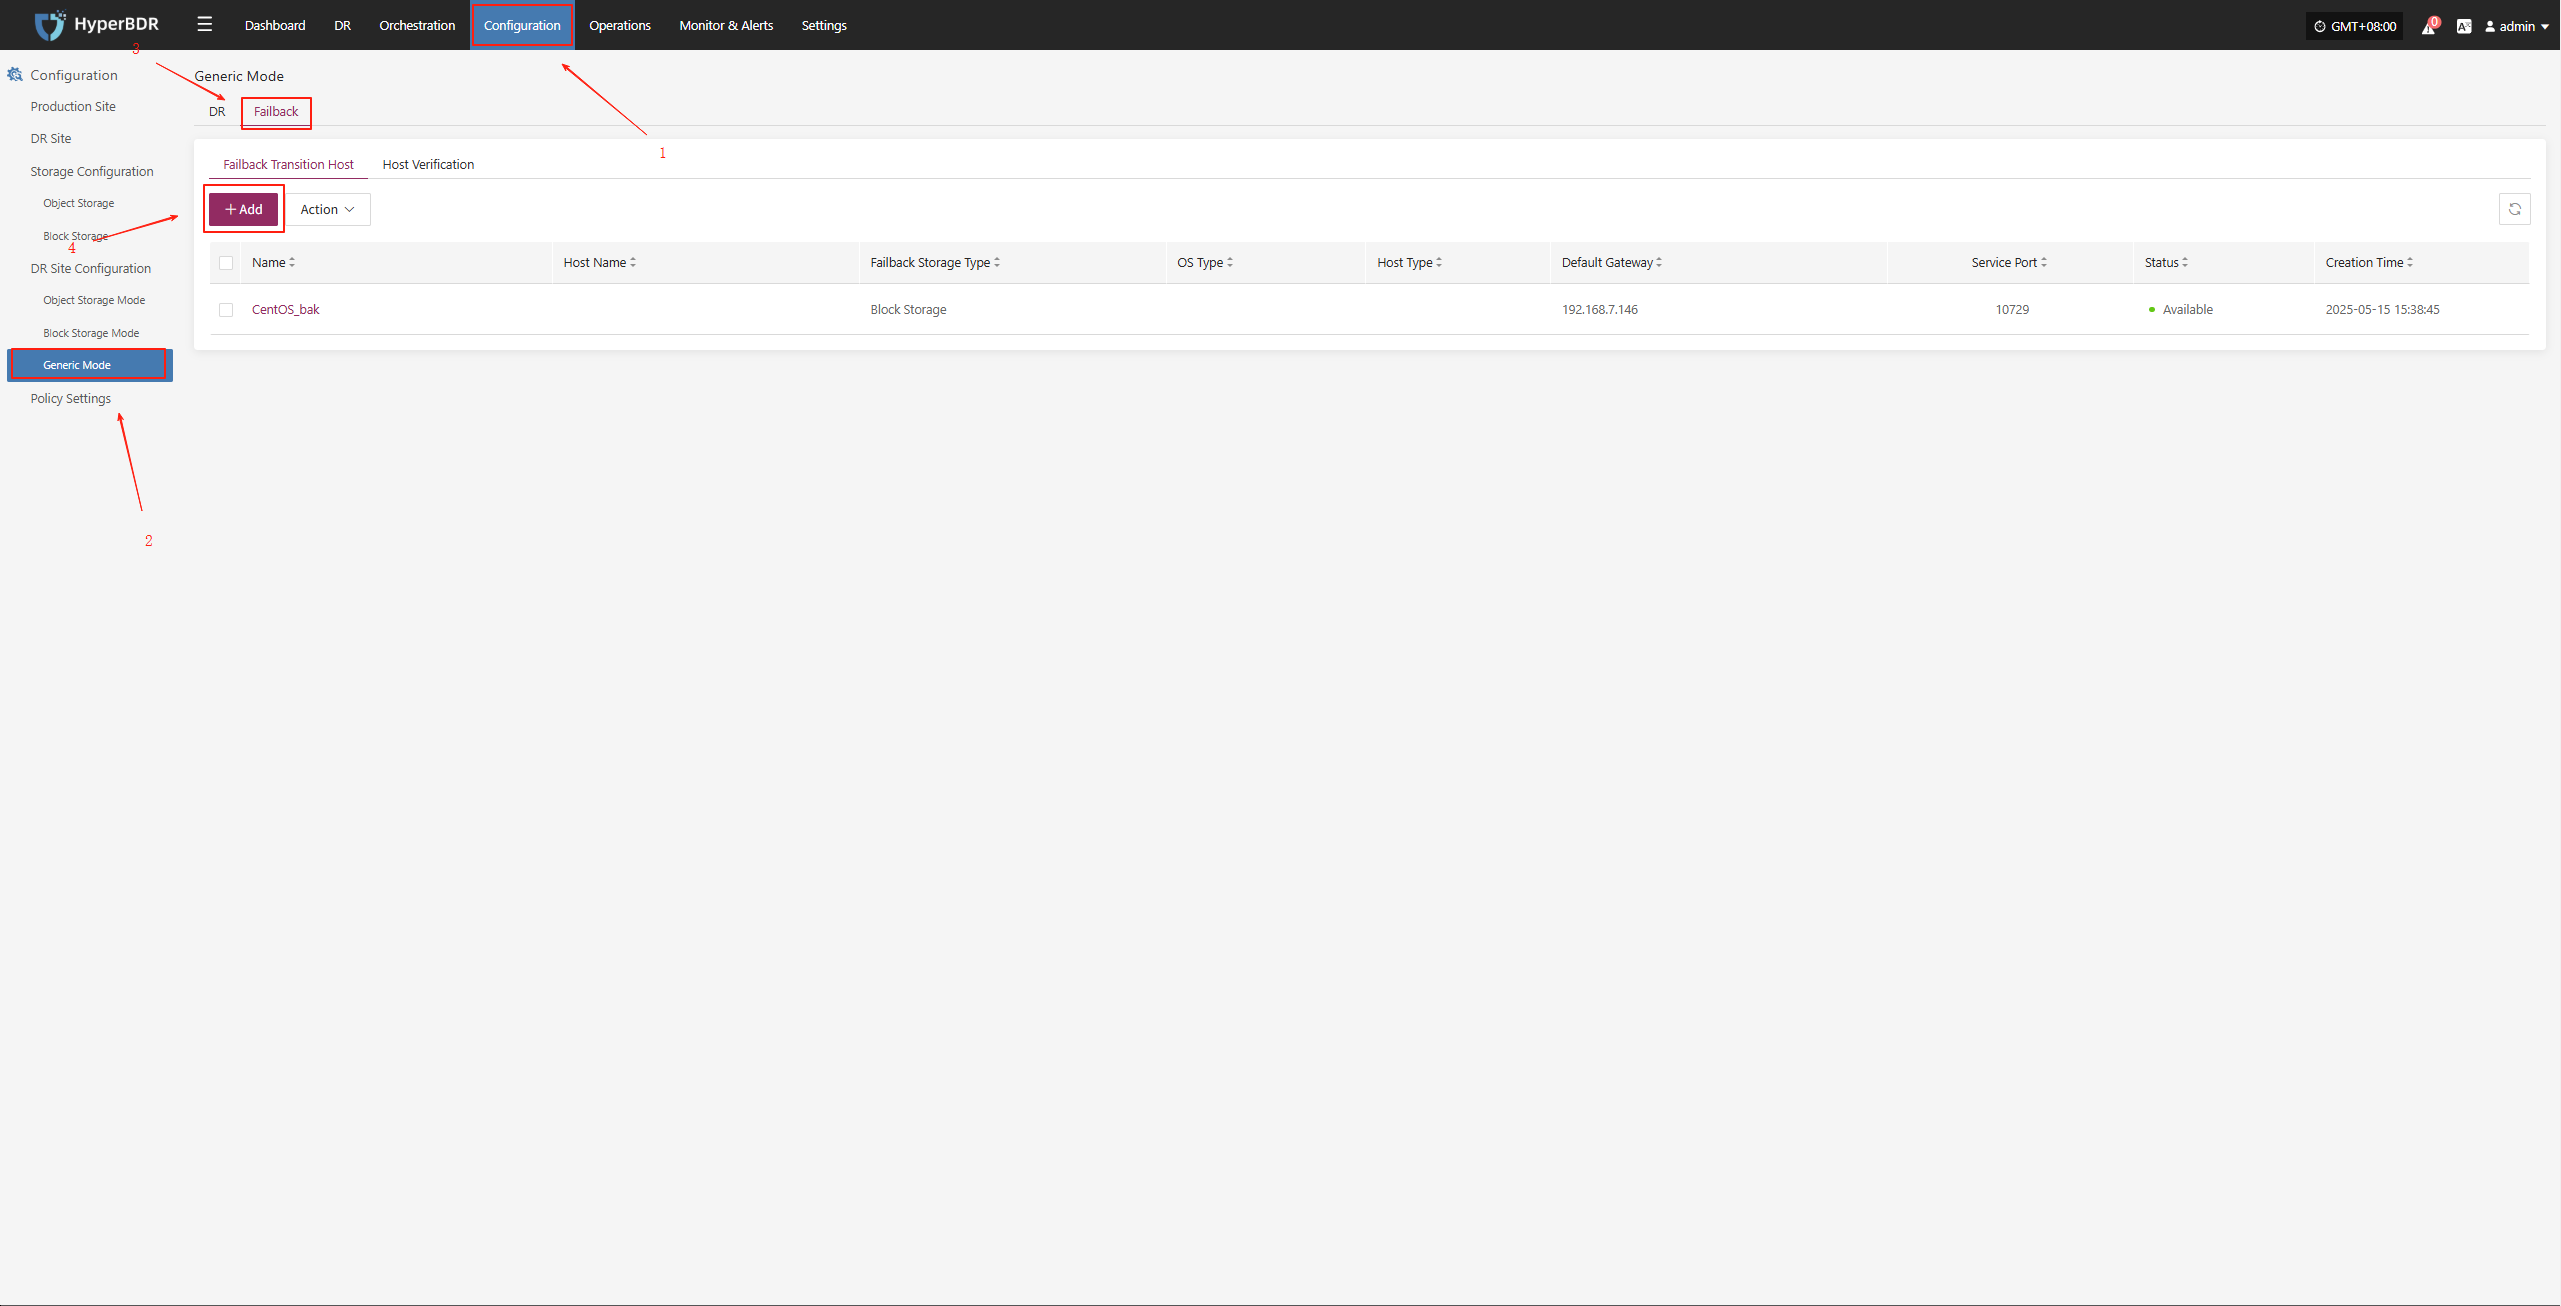
Download the latest temporary transition host image as needed and recreate the temporary transition host.
Report Management
Report Type
Supported Report Types and Descriptions
Currently, various system operation and management reports can be exported through the HyperBDR Console, making it convenient for users to regularly analyze and archive system status.
| Report Type | Description |
|---|---|
| Host DR Summary Report | Basic info for all registered and deregistered hosts, including sync, drill, and takeover counts, and system type. |
| Host Sync Data Detailed Report | Detailed statistics for all sync tasks of registered and deregistered hosts. |
| Host DR Drill Detailed Report | Detailed statistics for all drill tasks of registered and deregistered hosts. |
| Host DR Takeover Detailed Report | Detailed statistics for all takeover tasks of registered and deregistered hosts. |
| Host DR Cycle Summary Report(Day) | Daily summary of disaster recovery data for all registered and deregistered hosts. |
| DR Cloud Sync Gateway Summary Report | Basic info for all cloud sync gateways under the current tenant. |
| DR Cloud Sync Gateway Detailed Report | Detailed info for all cloud sync gateways under the current tenant, including each disk. |
Report Export
Report Export Operation Example
Log in to the HyperBDR-HyperMotion Console
- Note: If you need to download host information reports for different tenants, you must log in to the console with a user belonging to the corresponding tenant.
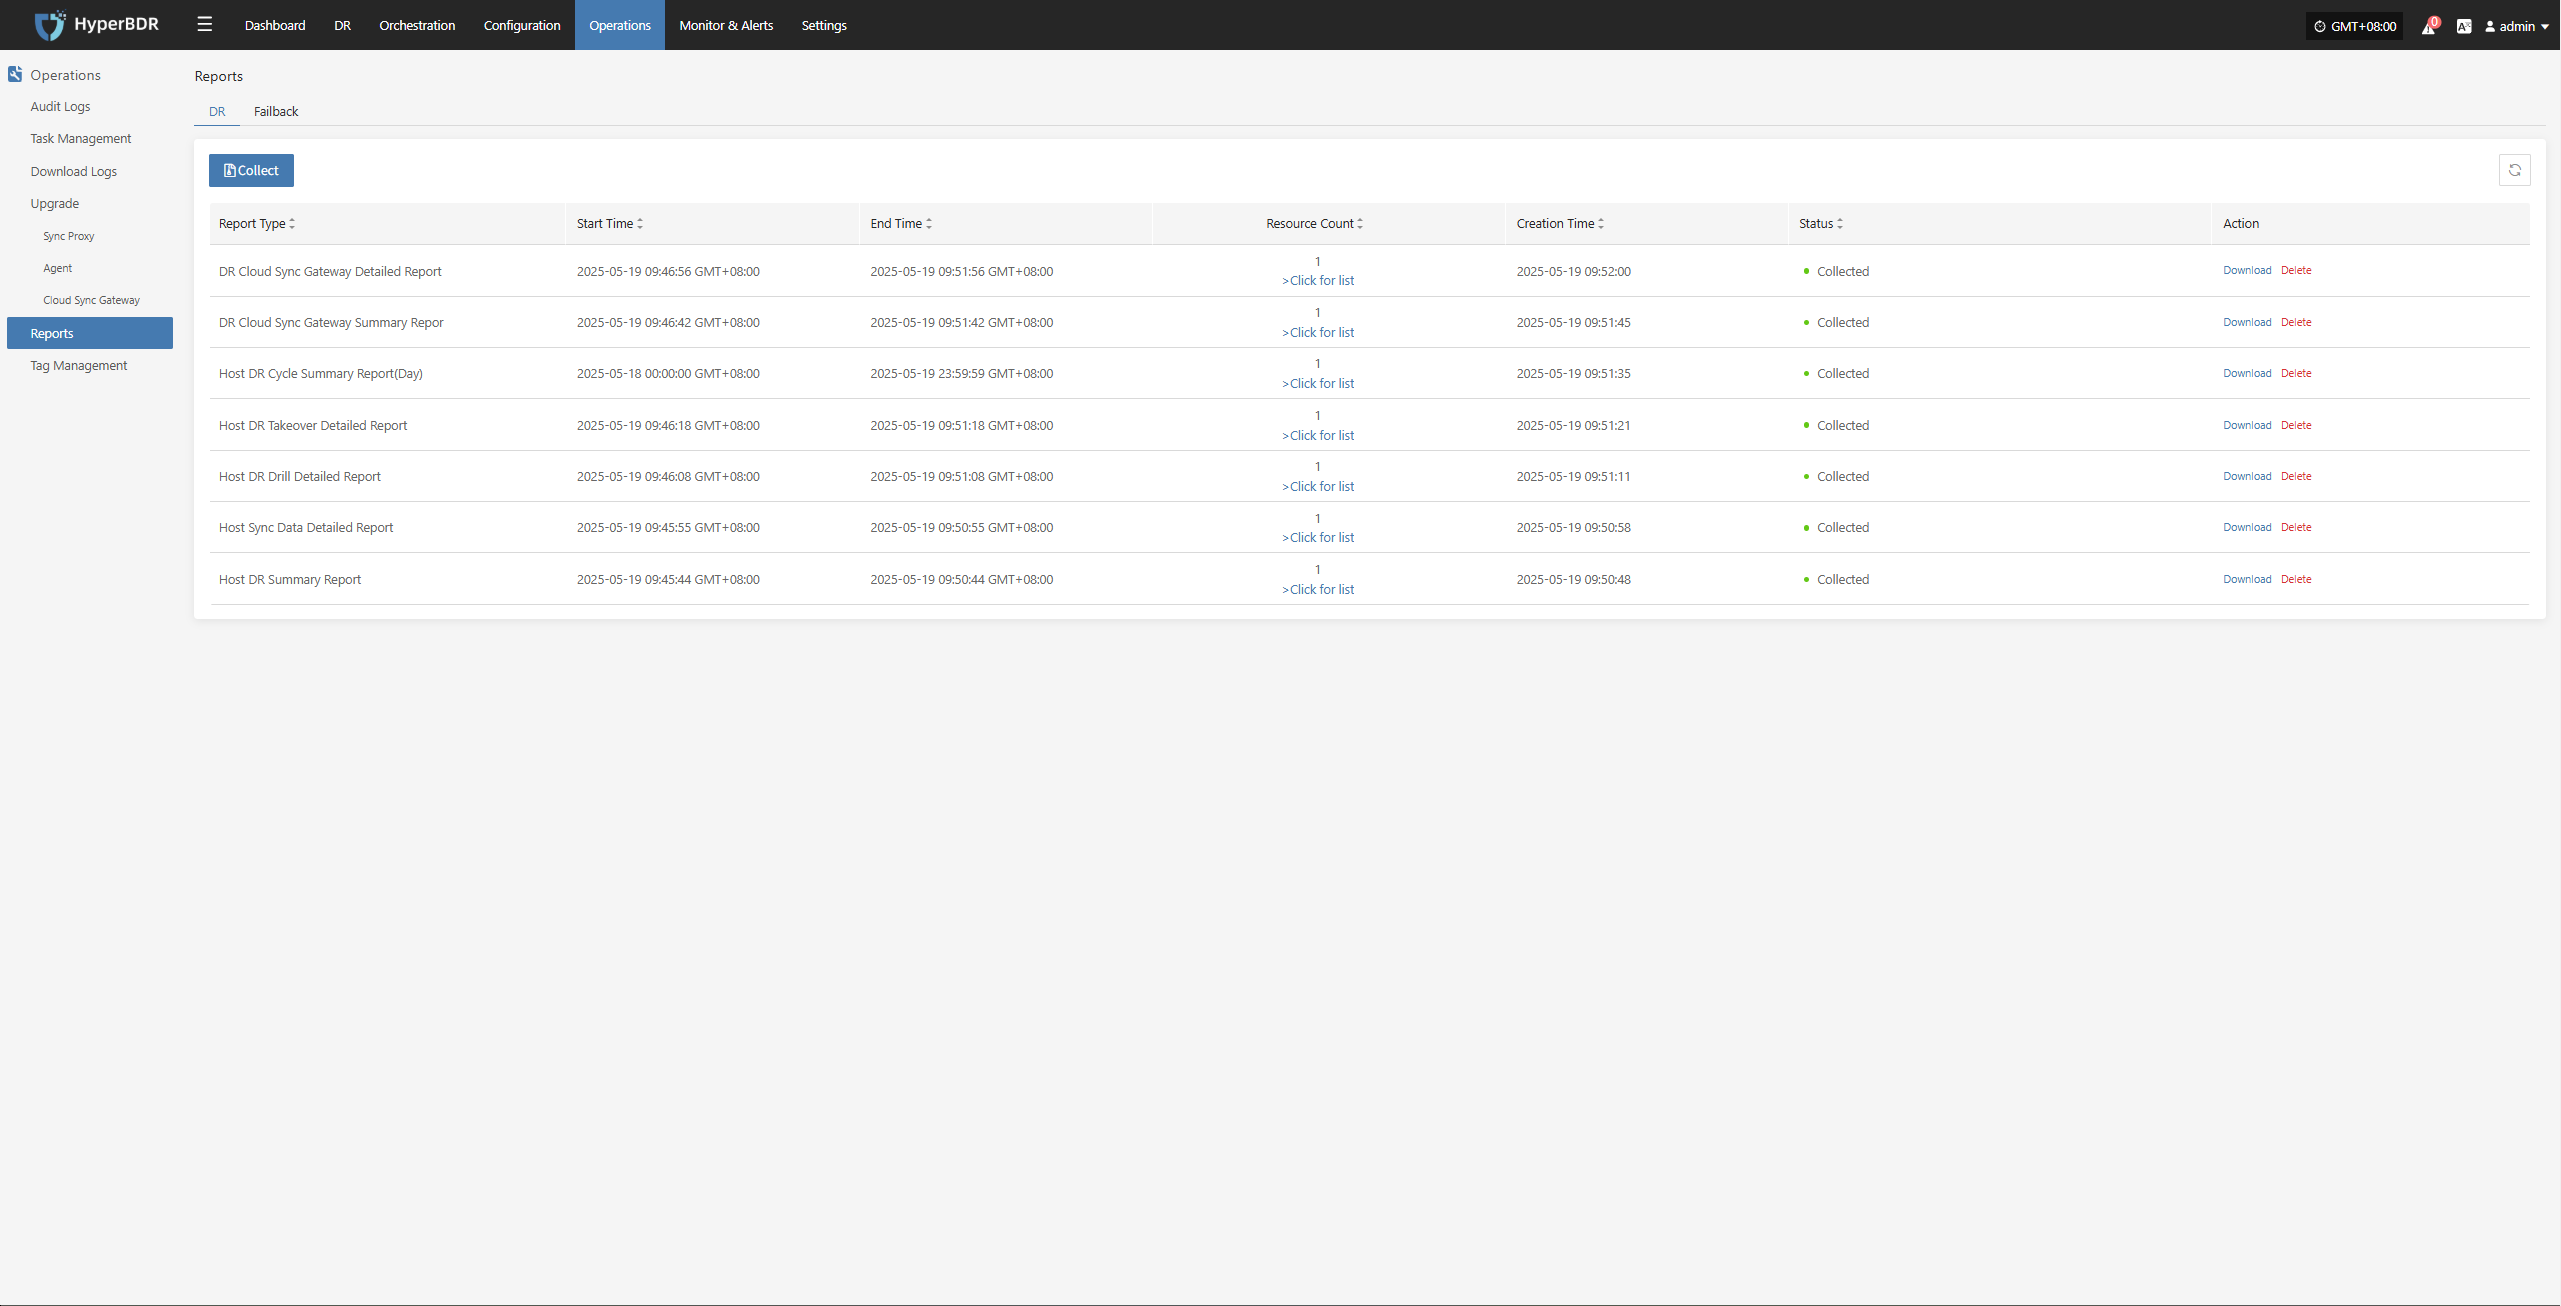
Click [Operations] > [Report] to enter the report page.
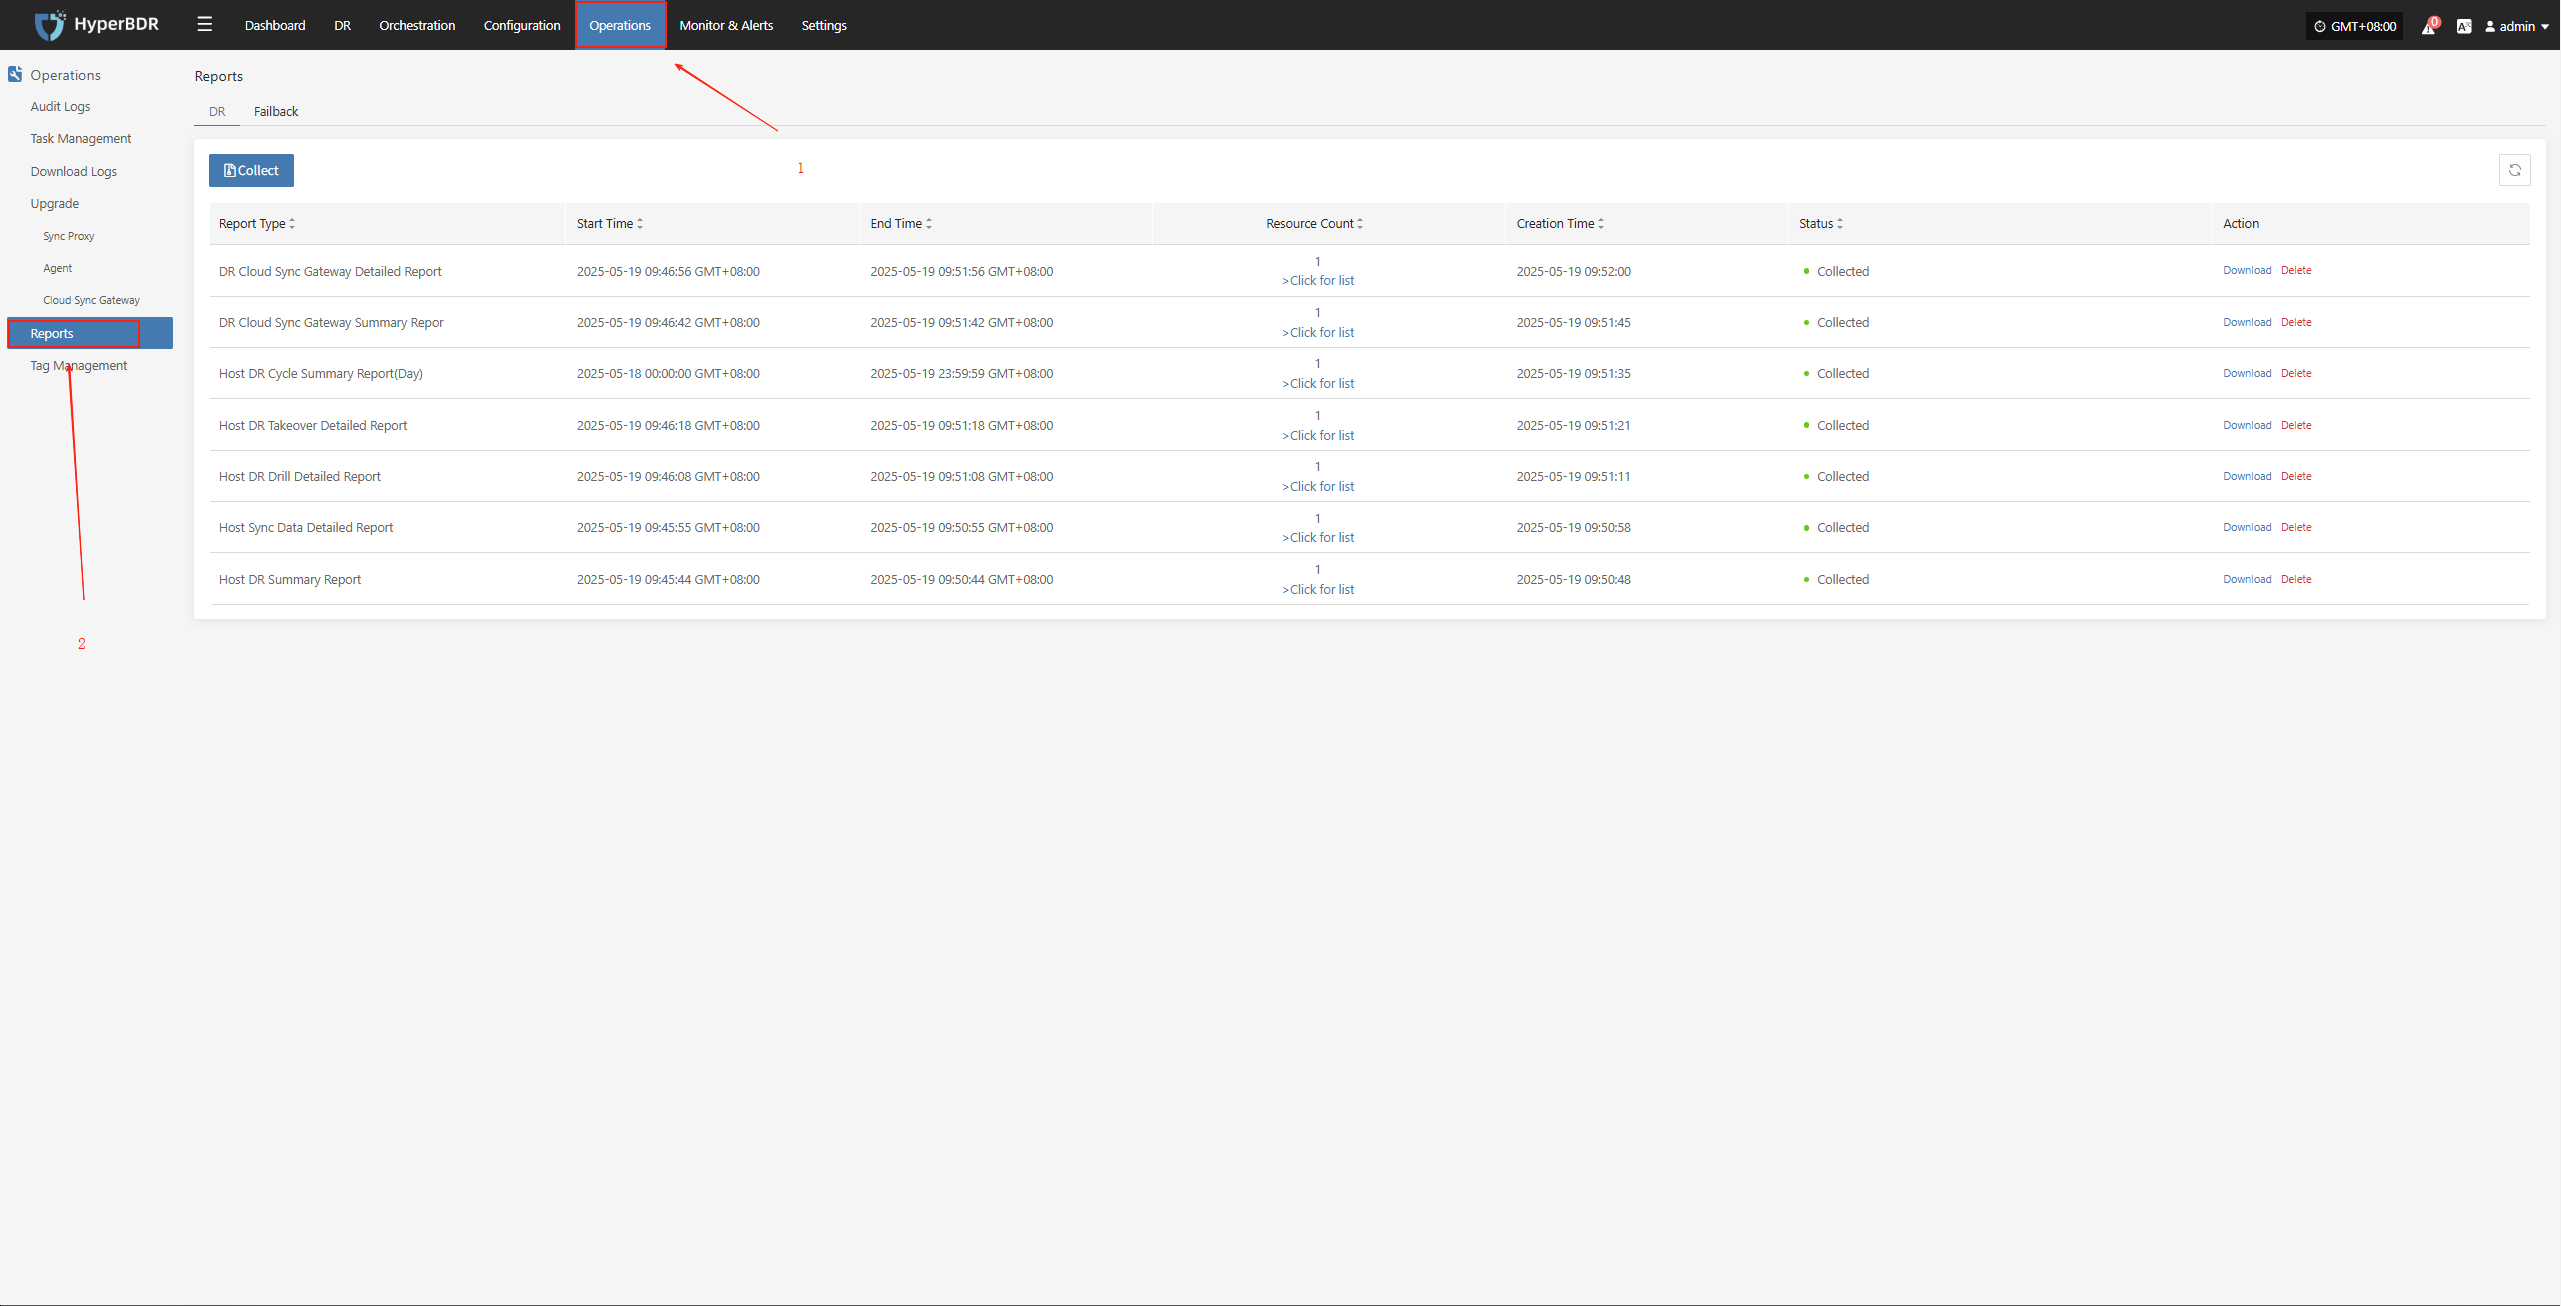
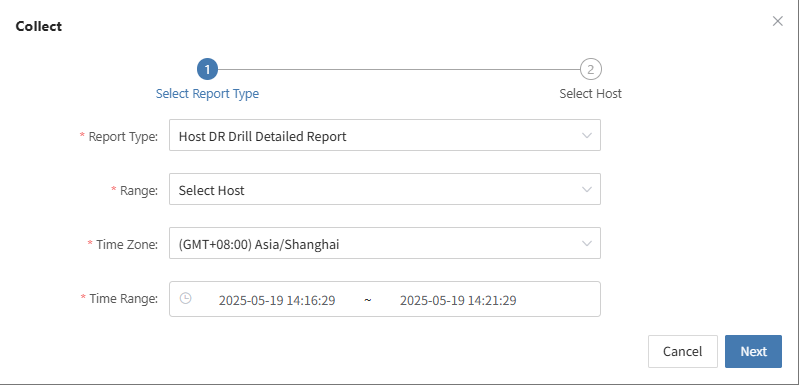
Collect reports
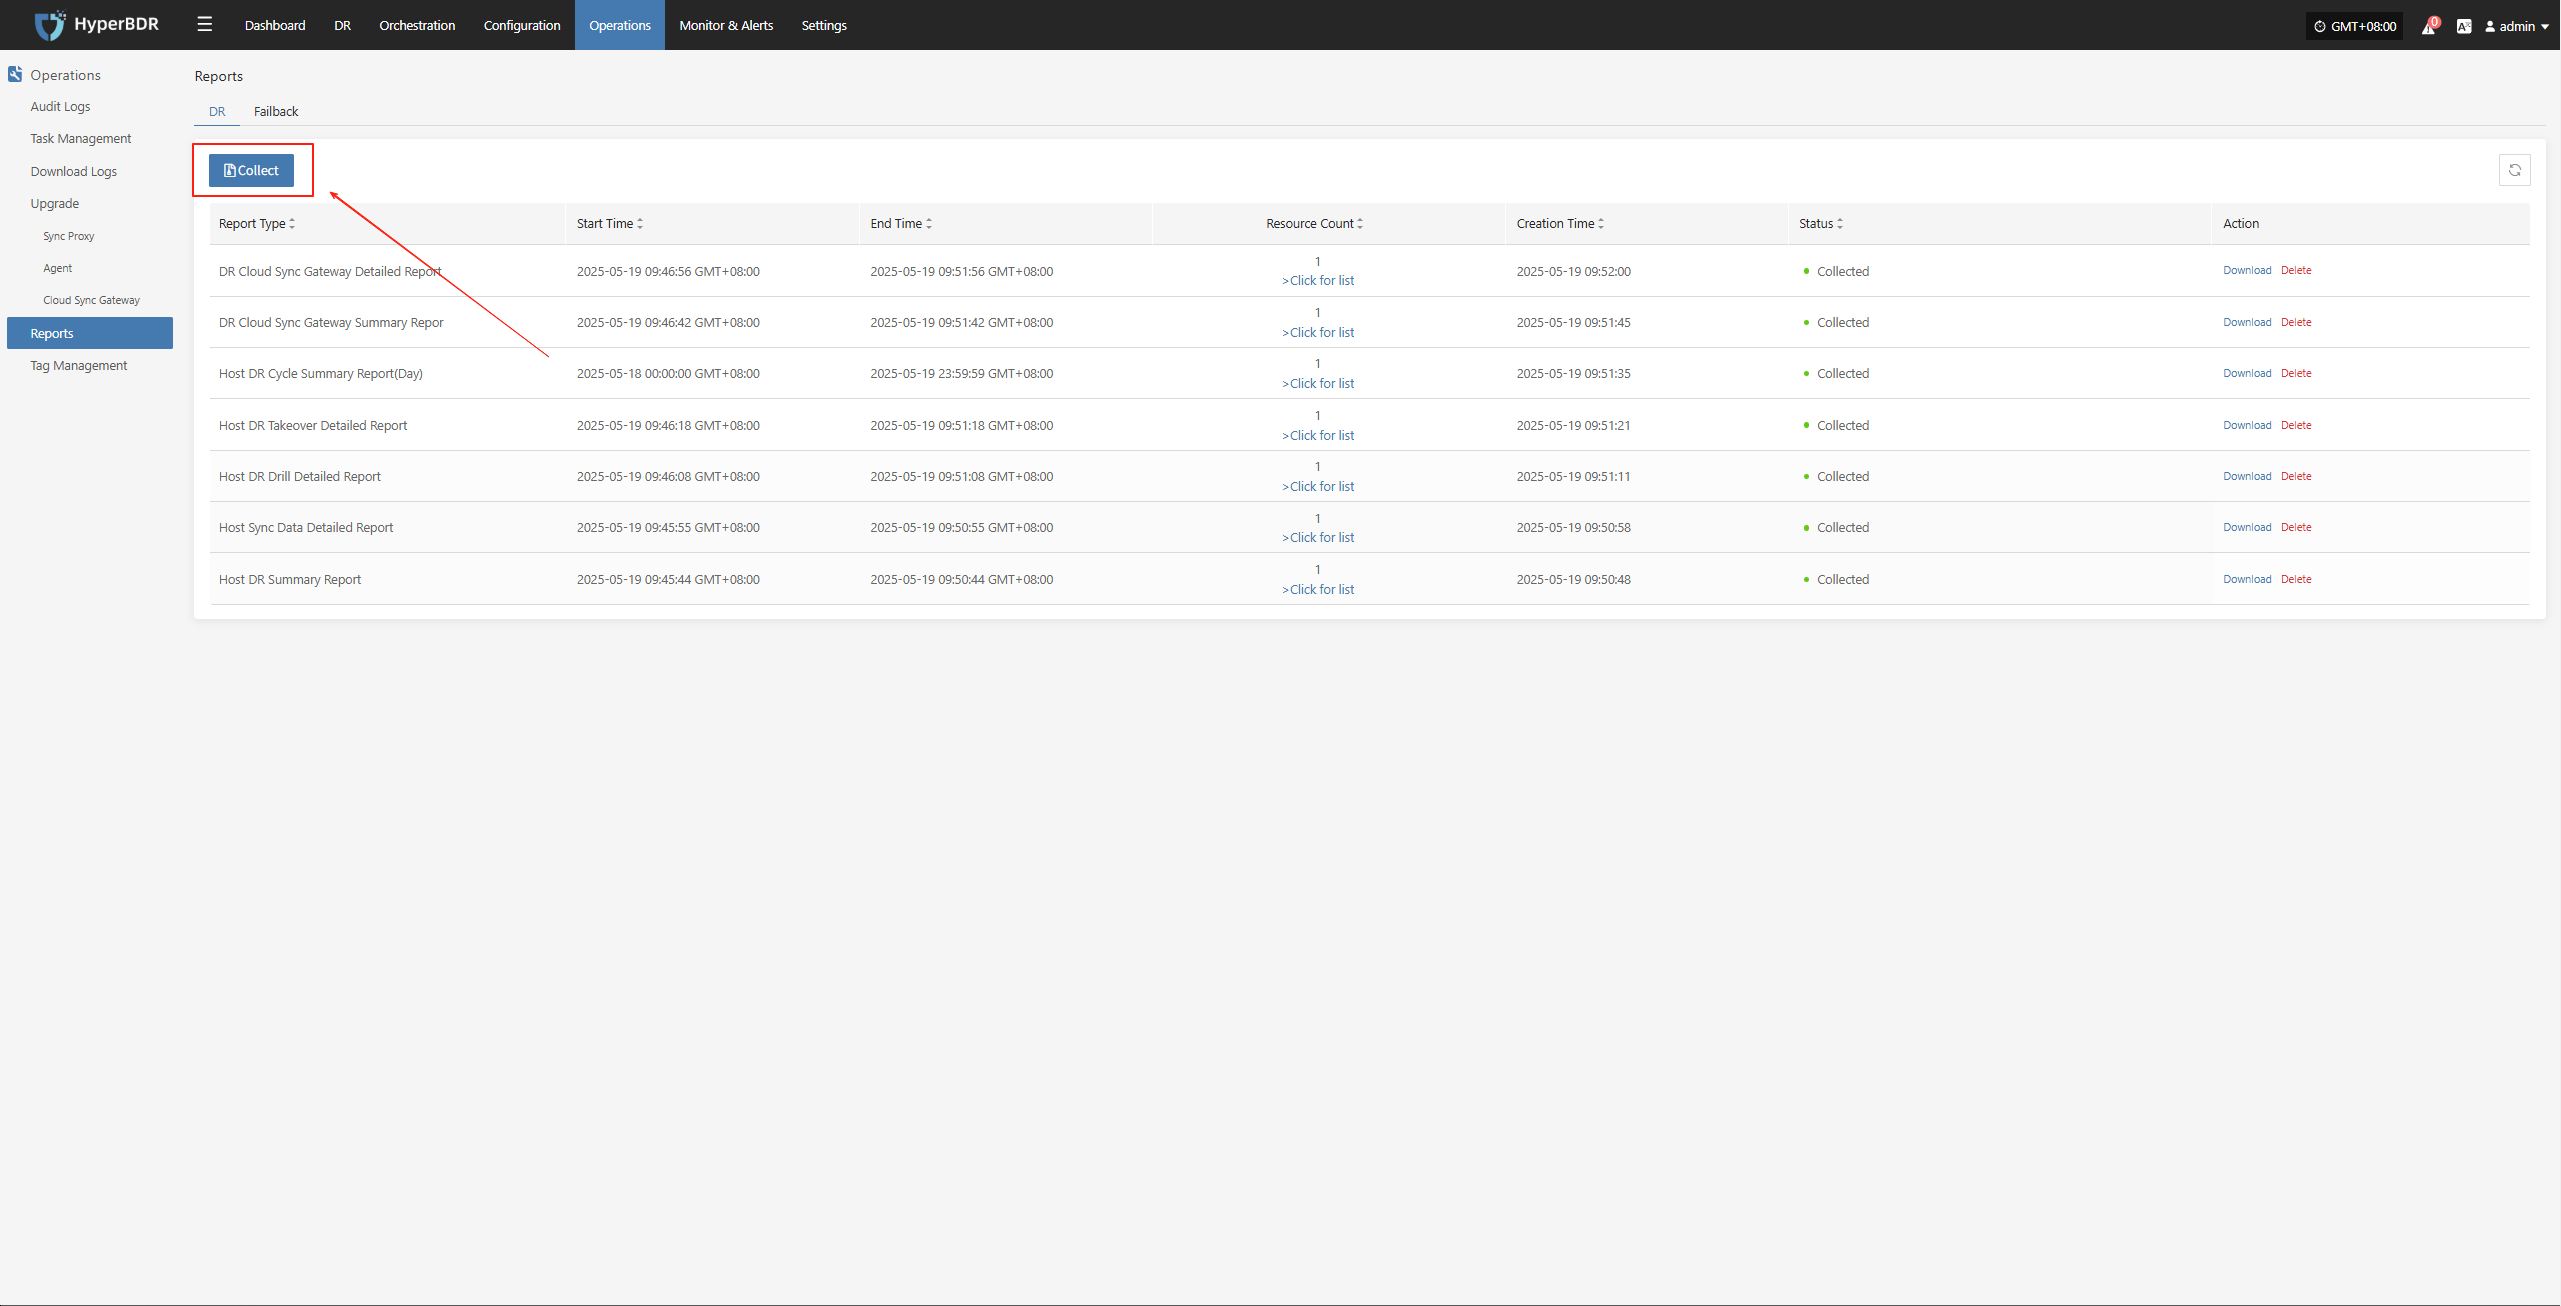
Select the report type, scope, time zone, and time range as needed. After confirming the information, click [Submit].

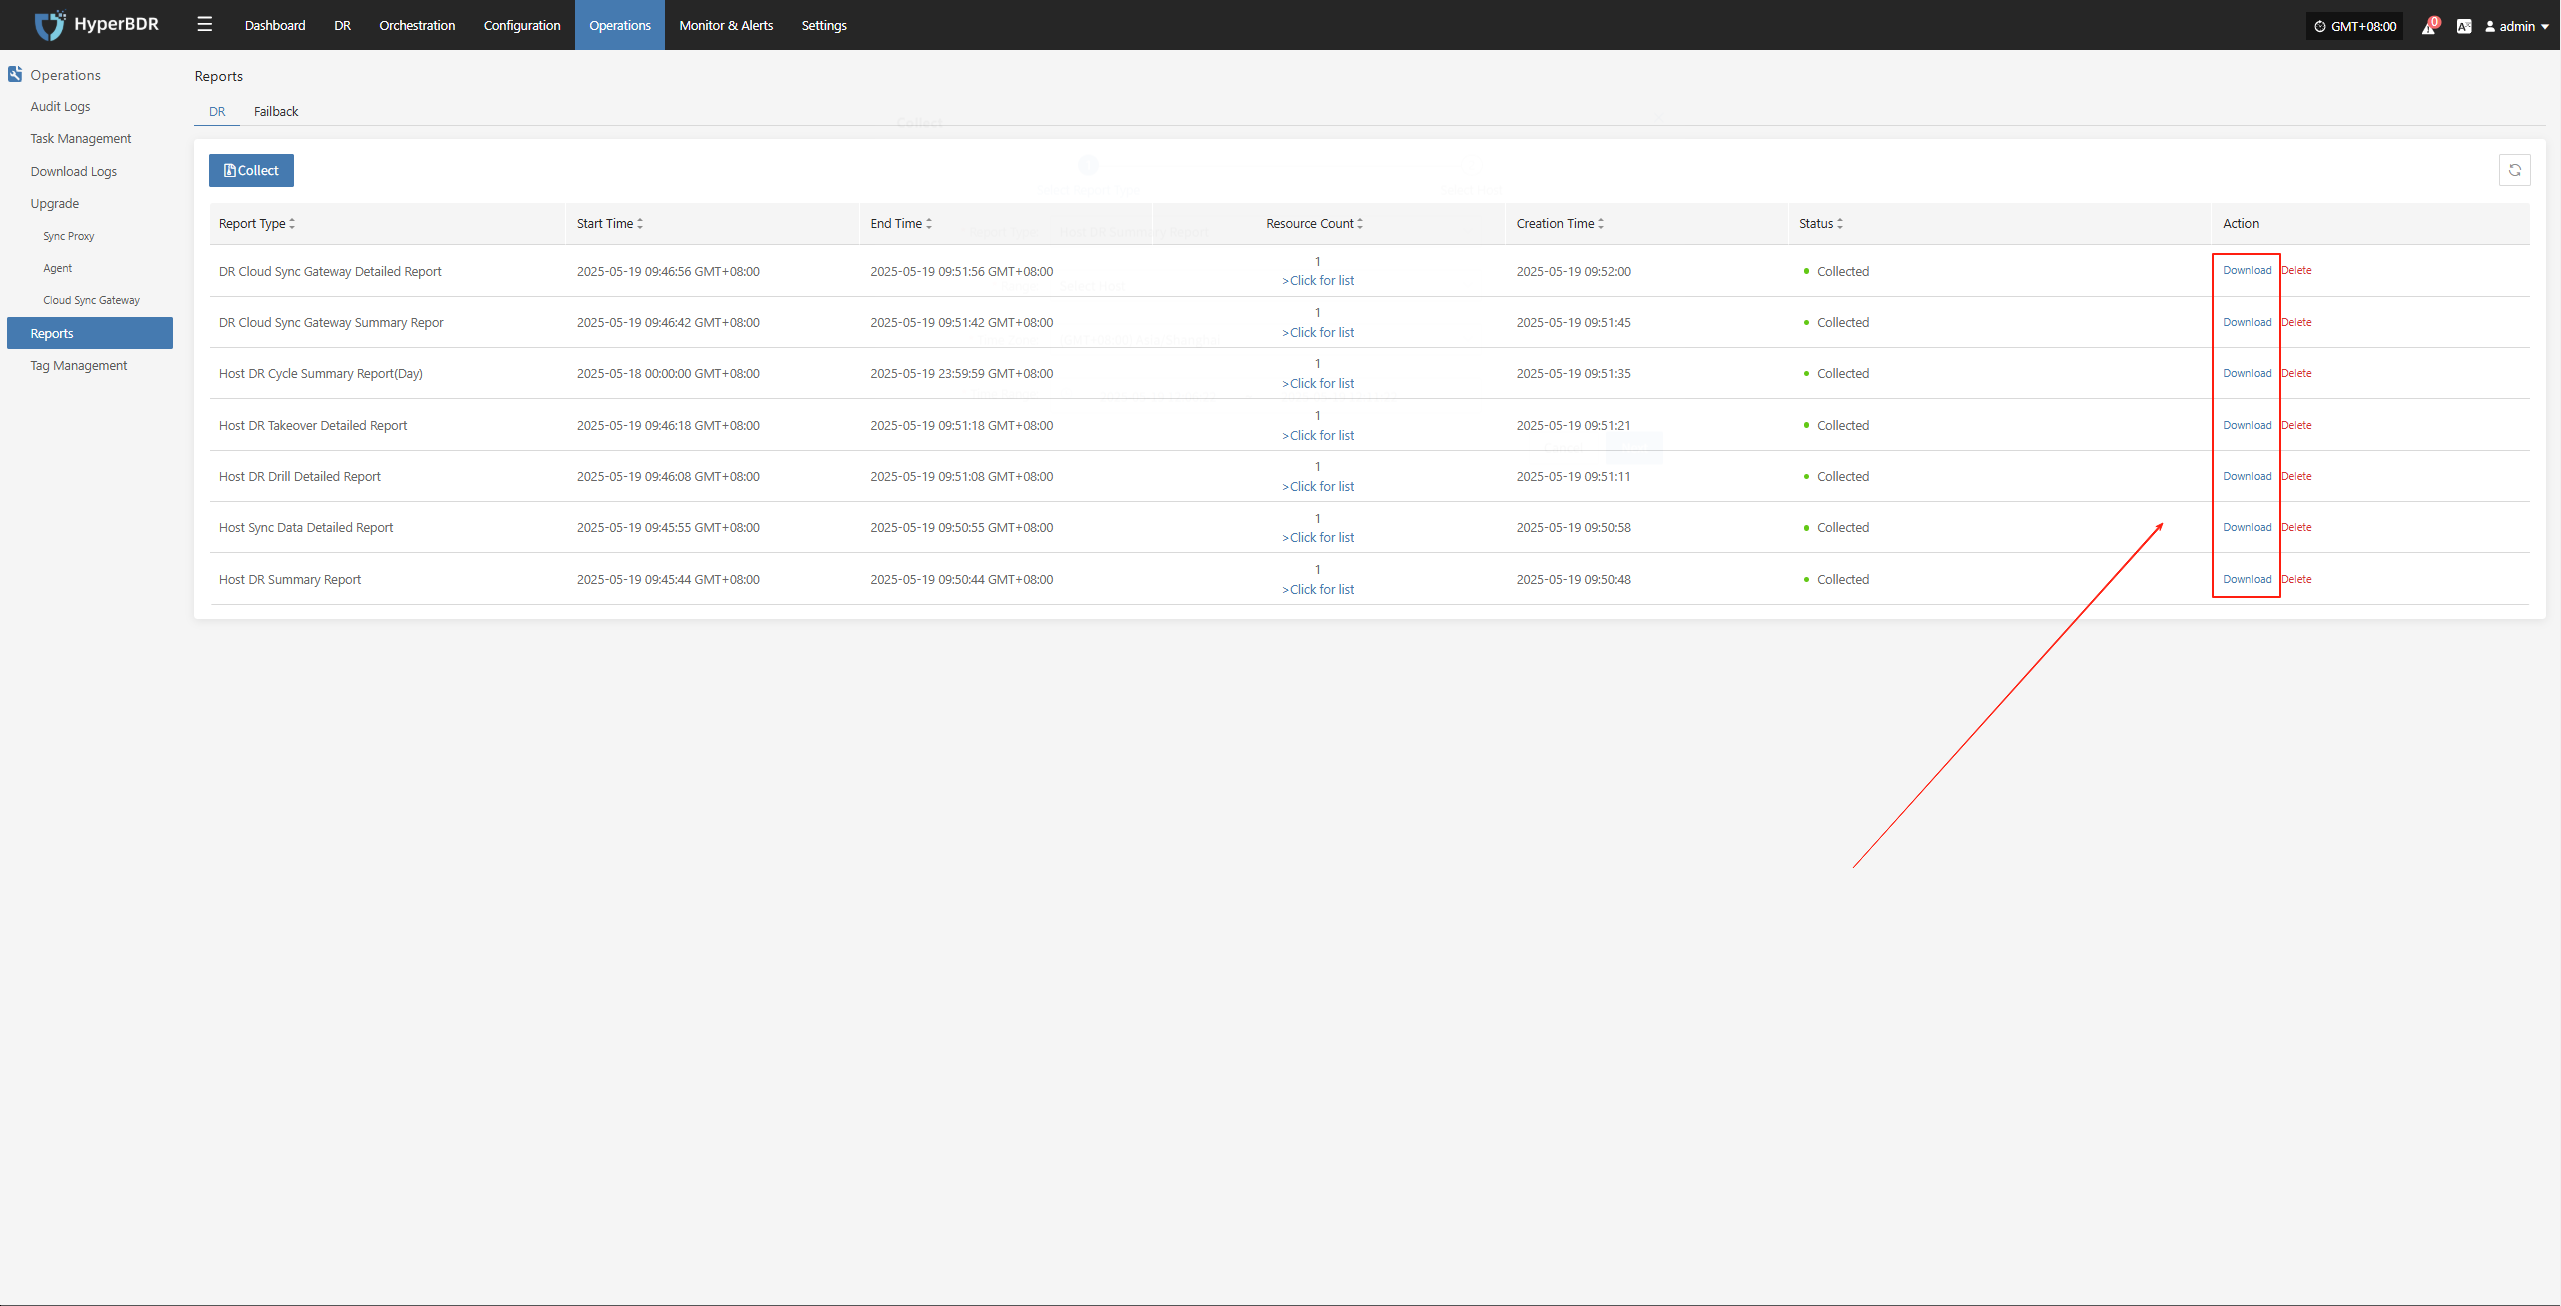
Download the report
- Click [Download] to get the report.
Monitor & Alerts Management
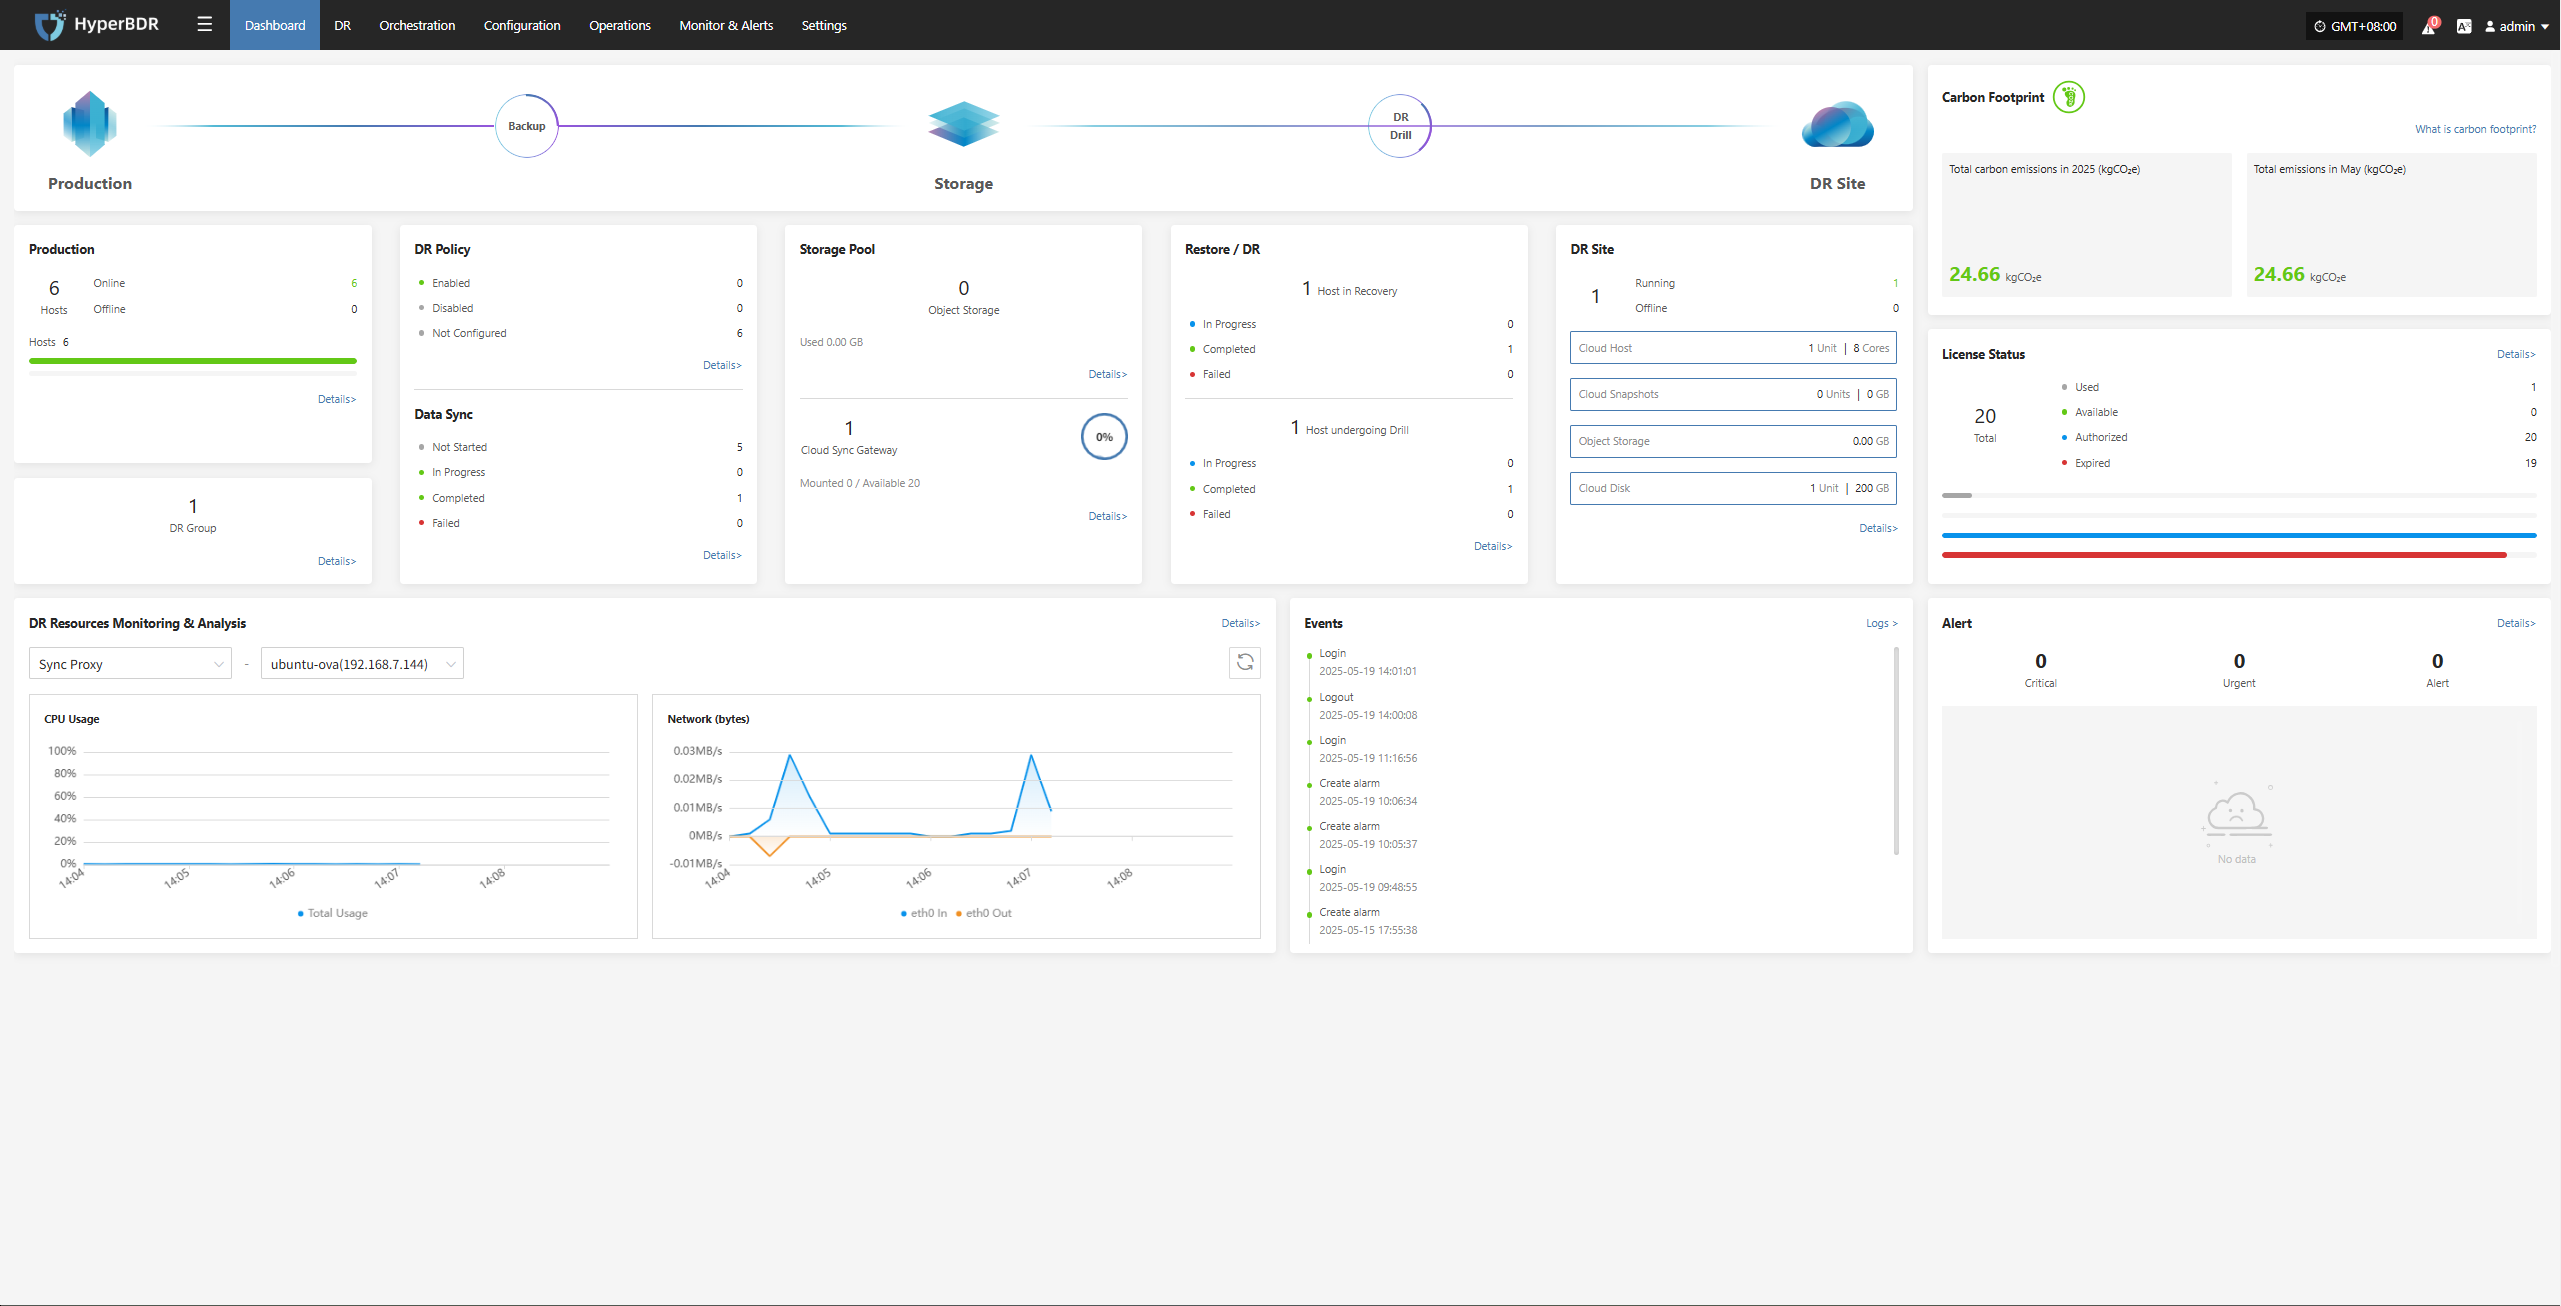
Overview Display
HyperBDR provides a disaster recovery overview monitoring interface. The overview page displays all resources and related summary data involved in the disaster recovery platform, allowing you to visually observe the overall operational status of the platform.
Key Indicators
System Level
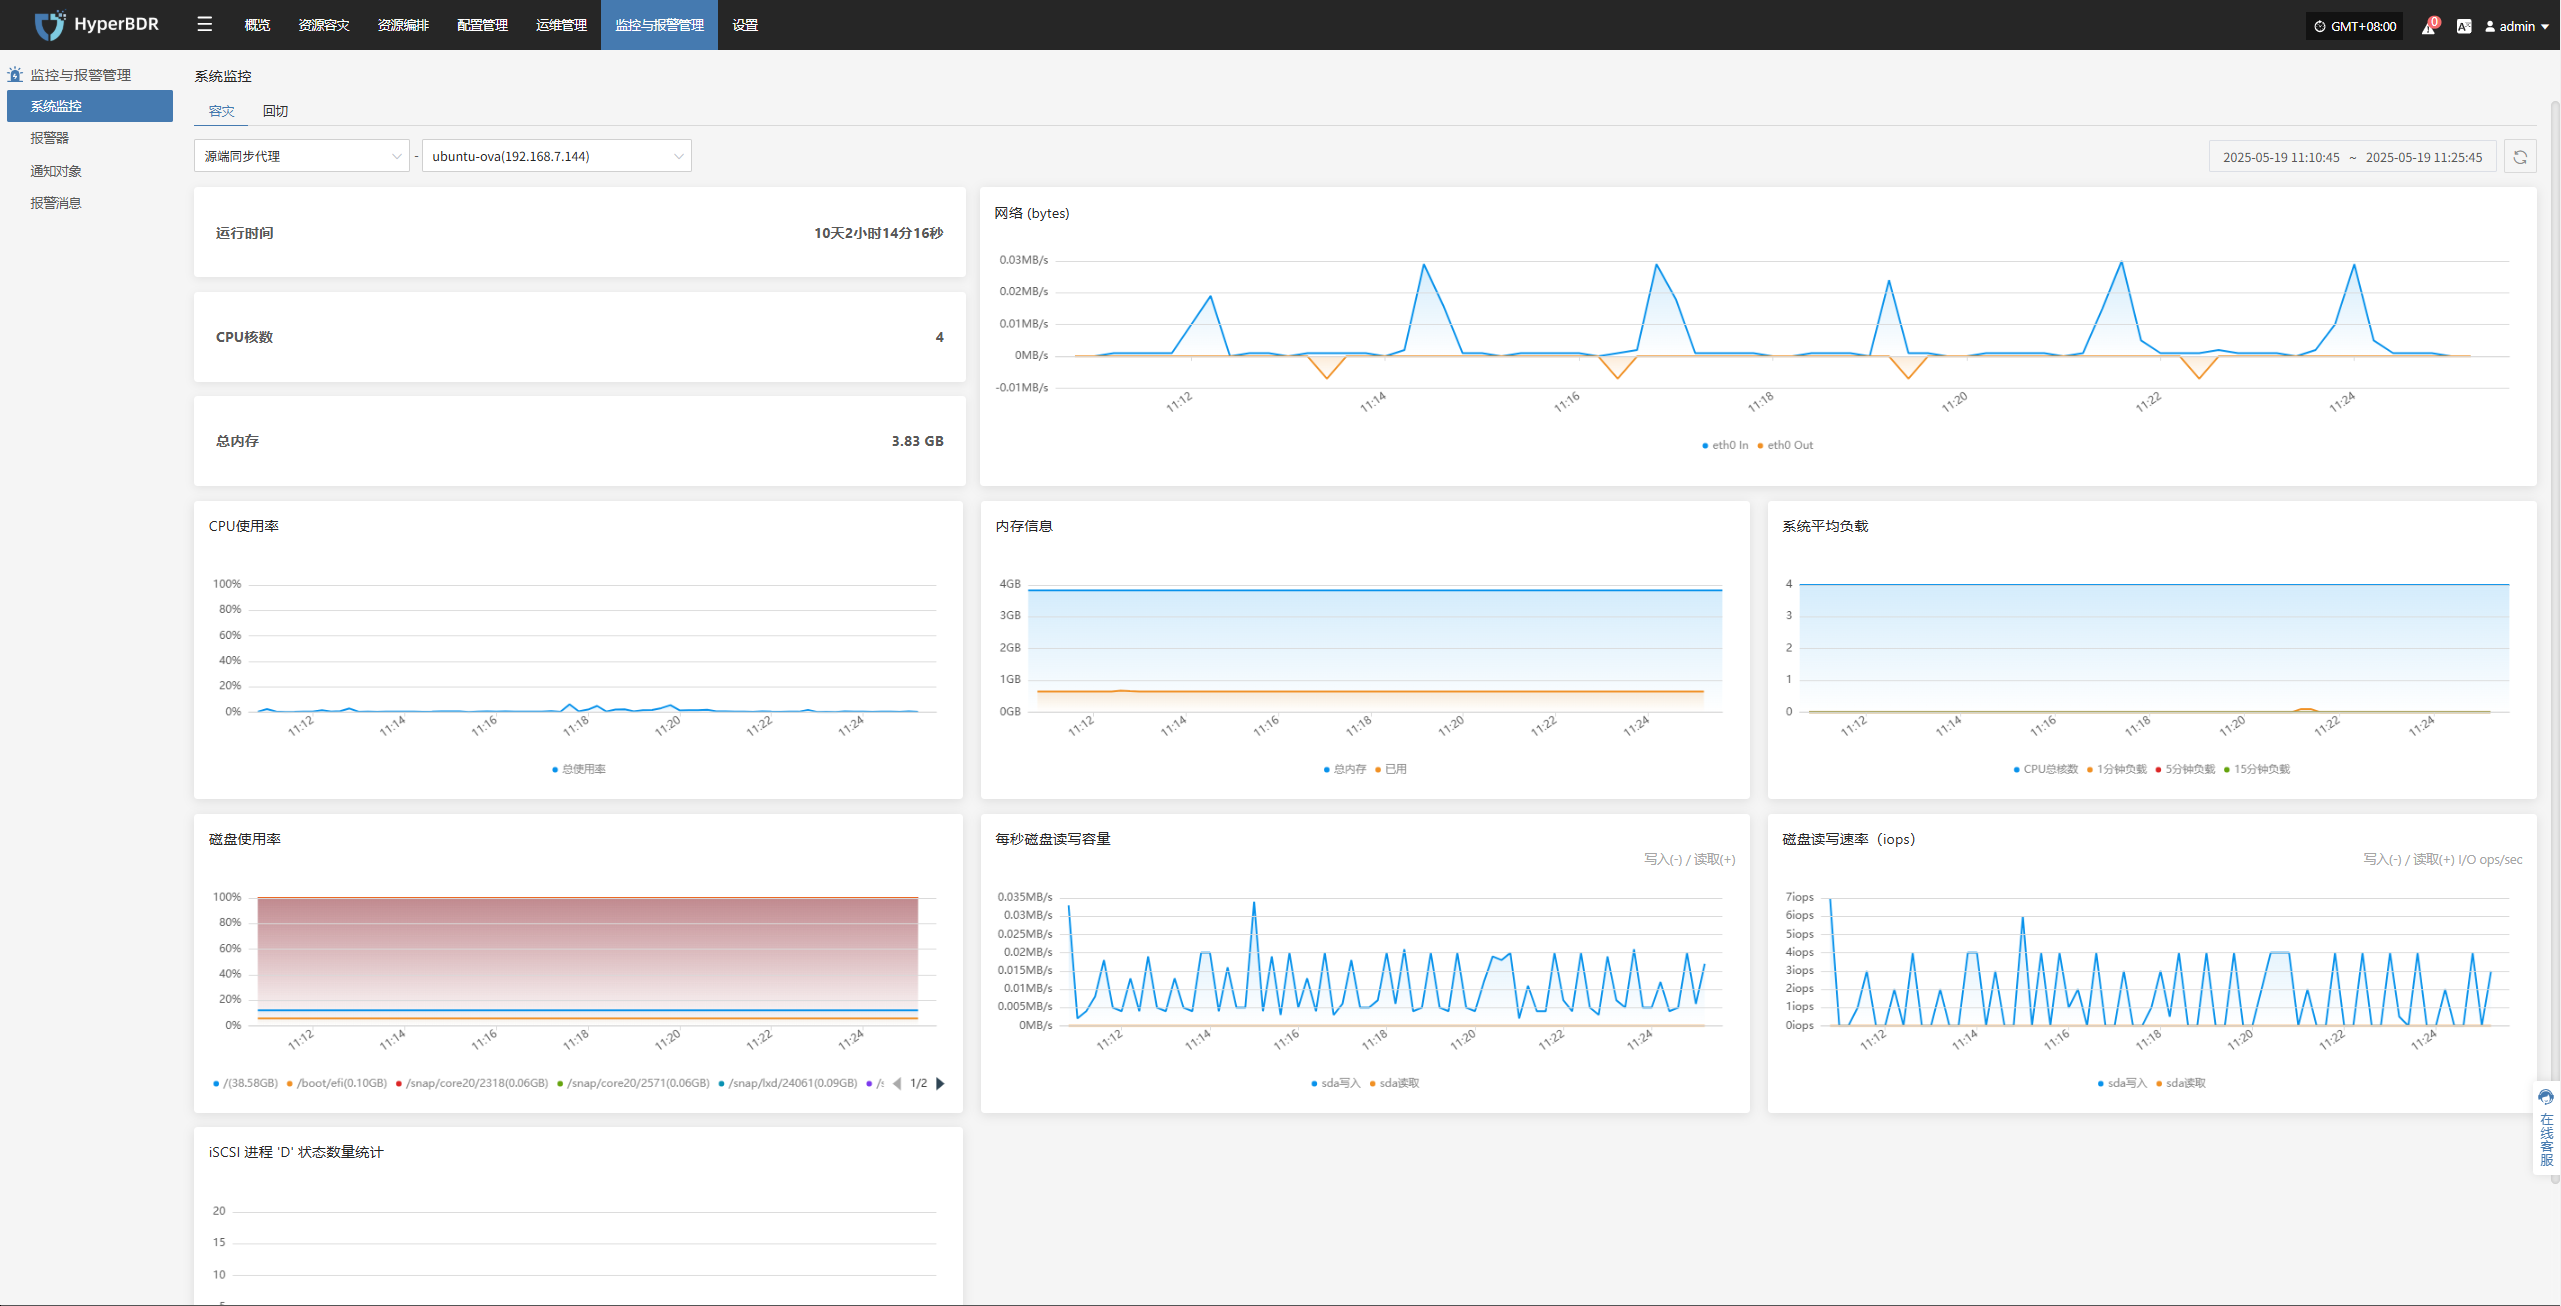
CPU / Memory Usage: Identify if there are resource bottlenecks.
Number of Concurrent Tasks: Monitor the number of backup/restore/sync tasks currently running.
Network Throughput: Pay attention to data transfer speed and assess if there is network congestion.
DR Drill & Failover Level
Task Success Rate: Trigger alerts if the failure rate of backup or restore tasks exceeds the threshold.
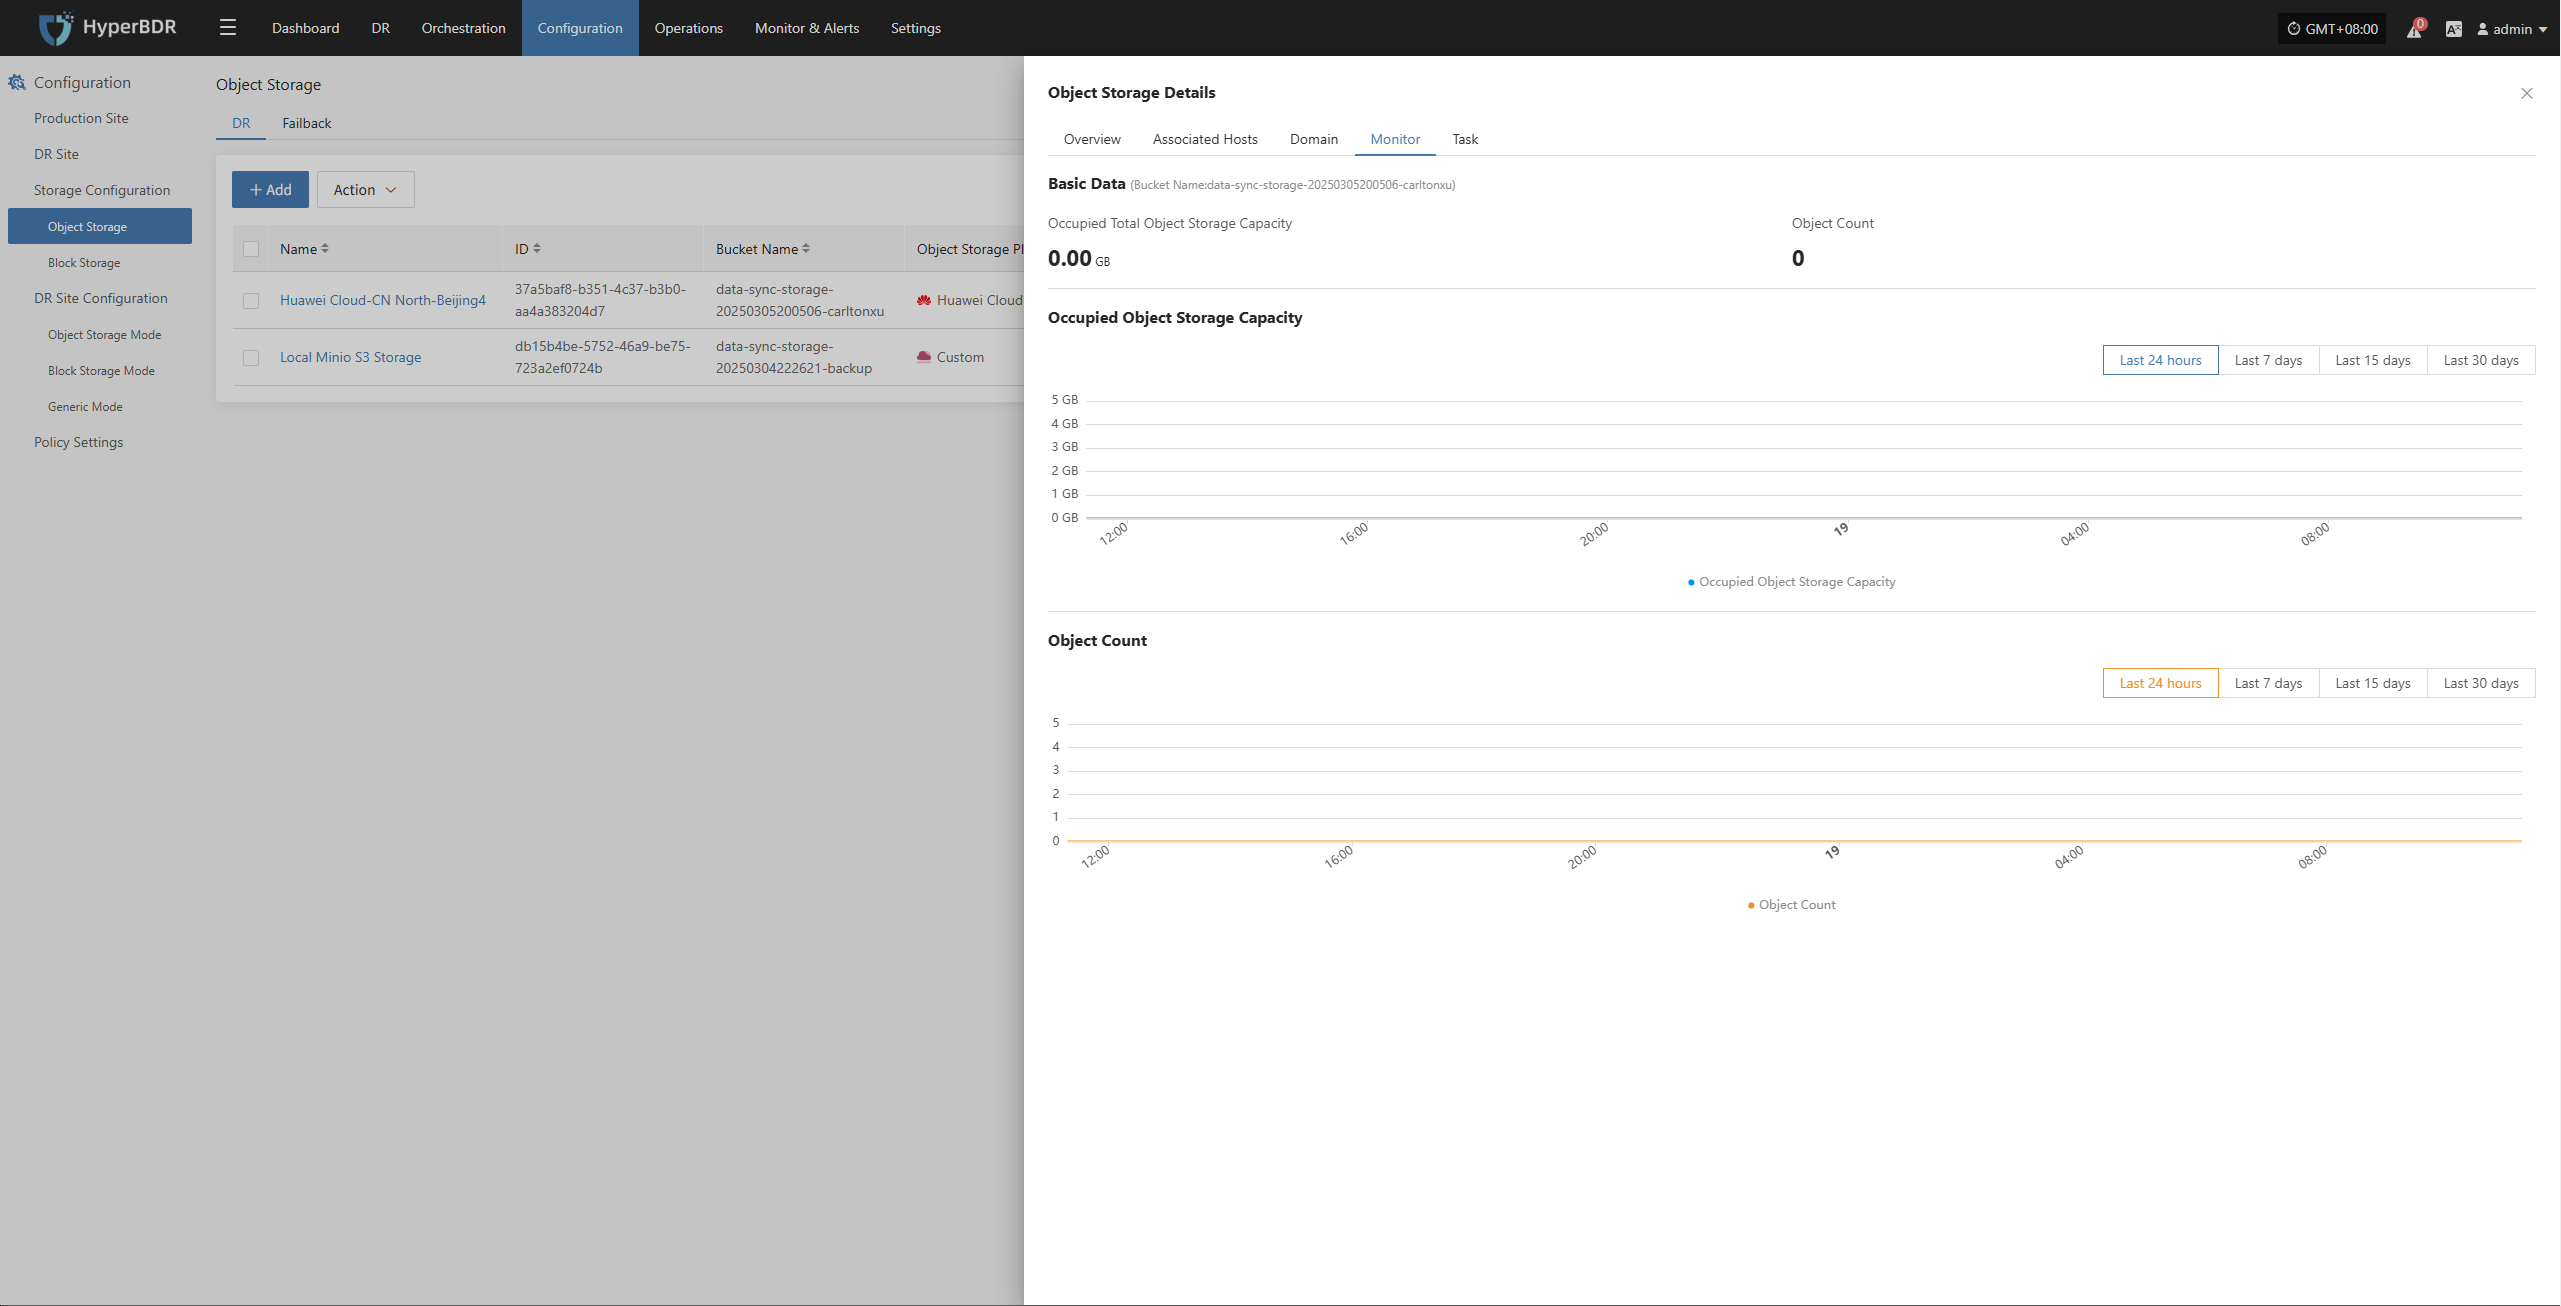
Number and Size of Snapshots: Monitor the storage space occupied by snapshots to avoid running out of storage.
Resource Usage: Includes usage of resources such as cloud hosts and cloud storage.
Alarms and Events
Alarm Level Distribution: Count the current alarms by level (info, warning, critical), and prioritize handling of high-level alarms.
Event Trends: Observe changes in the number of alarms over a certain period (e.g., 7 days, 30 days) to quickly identify potential issues.
Monitoring Alerts
Alarm Threshold Setting
Set reasonable thresholds and levels (warning, critical, emergency) for core metrics such as CPU, memory, network, and task failure rate.
For key task events (such as backup tasks), stricter alarm conditions can be set.
Currently, alarms can be created for both resources and events.
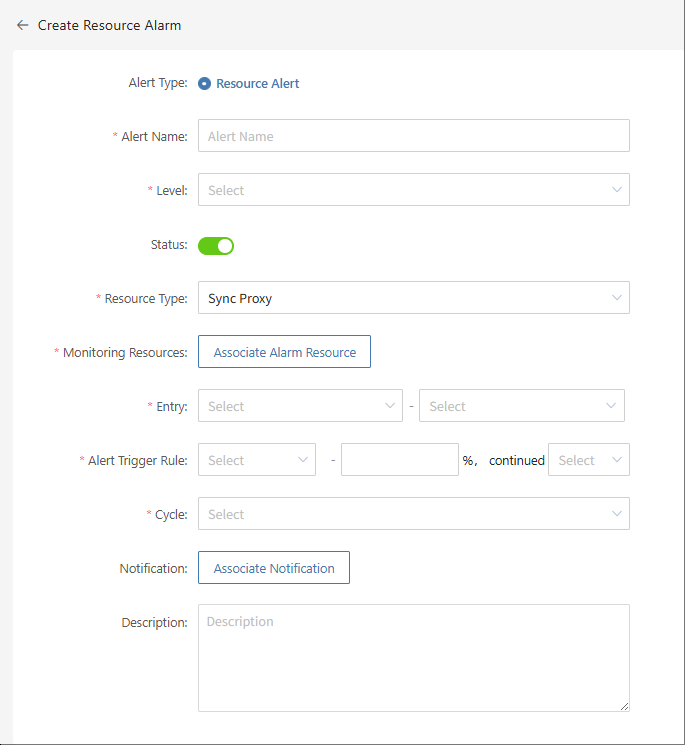
- Create Resource Alarm
Define the alarm name, alarm level, and resource type. Configure resource alarms for CPU, memory, disk, and processes. When the threshold is reached, an alarm event will be triggered.
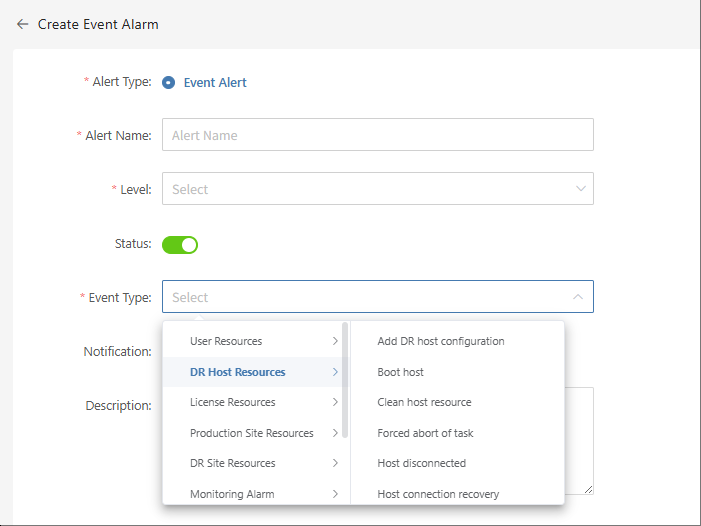
- Create Event Alarm
Define the event alarm name, alarm level, and event type. Configure event alarms for disaster recovery host resources, production platform resources, disaster recovery platform resources, etc. When the event is triggered, an alarm event will be sent.
Important Alarm Metrics
Event type: DR host resource "Host disconnected", event result "Success".
Event type: DR host resource "Sync host", event result "Failure".
Event type: DR host resource "Boot host", event result "Failure".
Other monitoring metrics can be configured as needed.
Multi-channel Notification
Configure multiple alarm channels such as email, SMS, and IM (e.g., DingTalk, WeChat Work) to ensure timely awareness of issues.
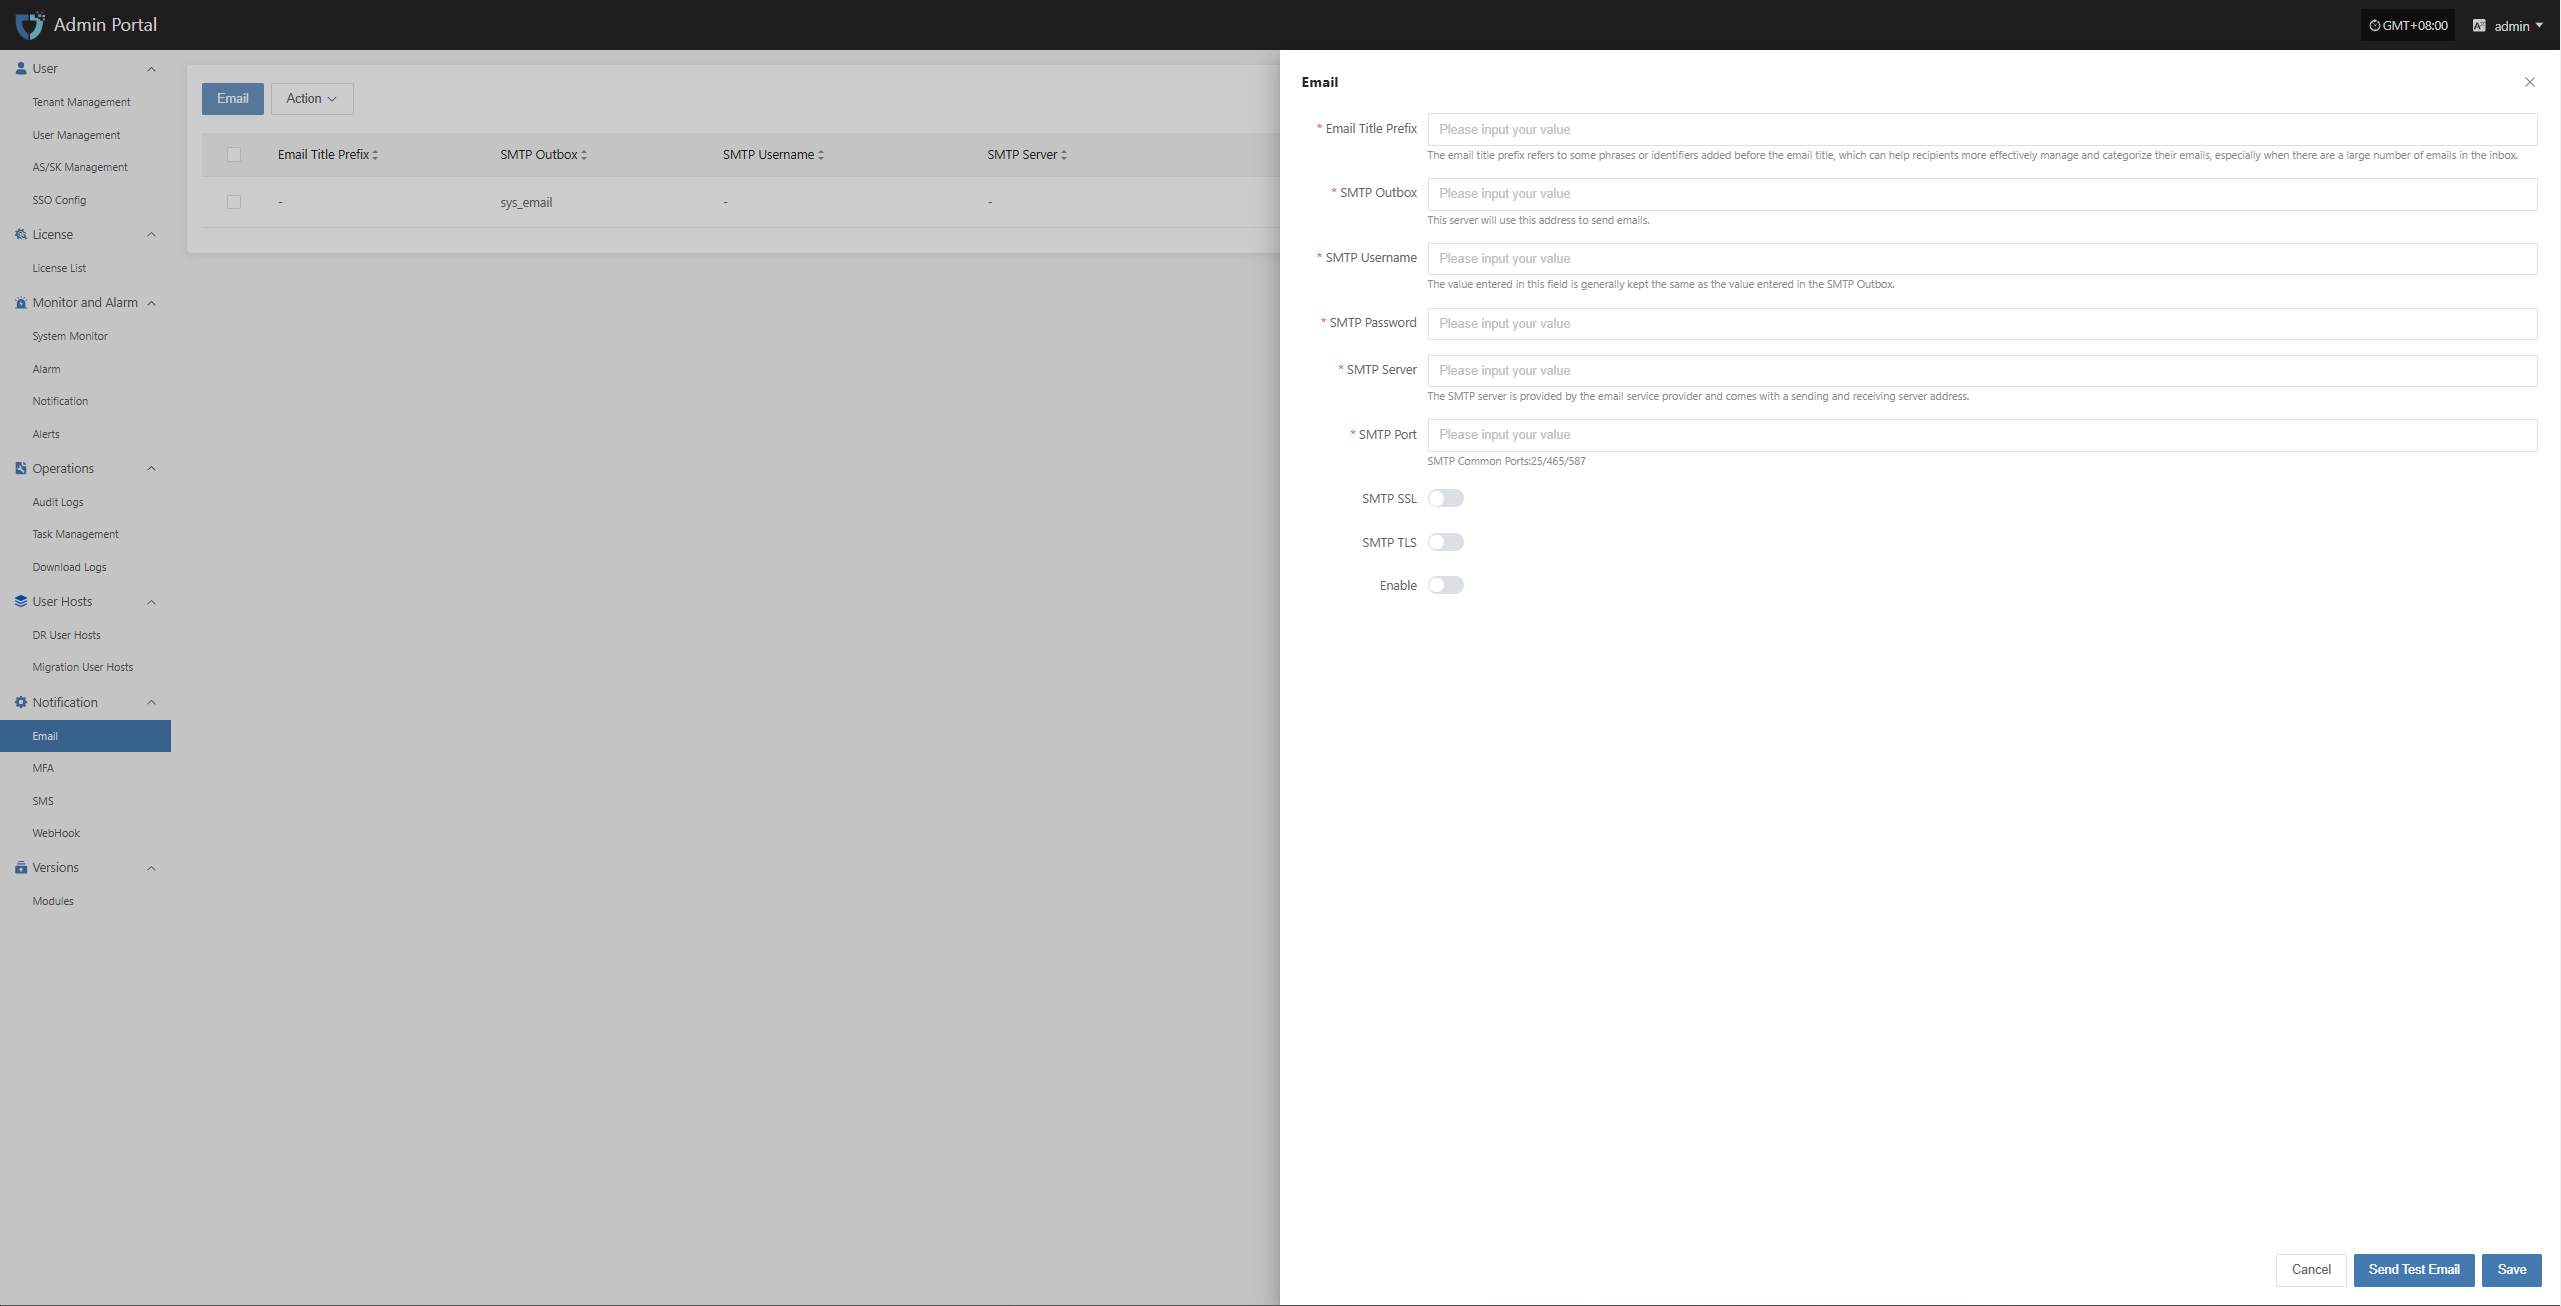
Email alarm channel
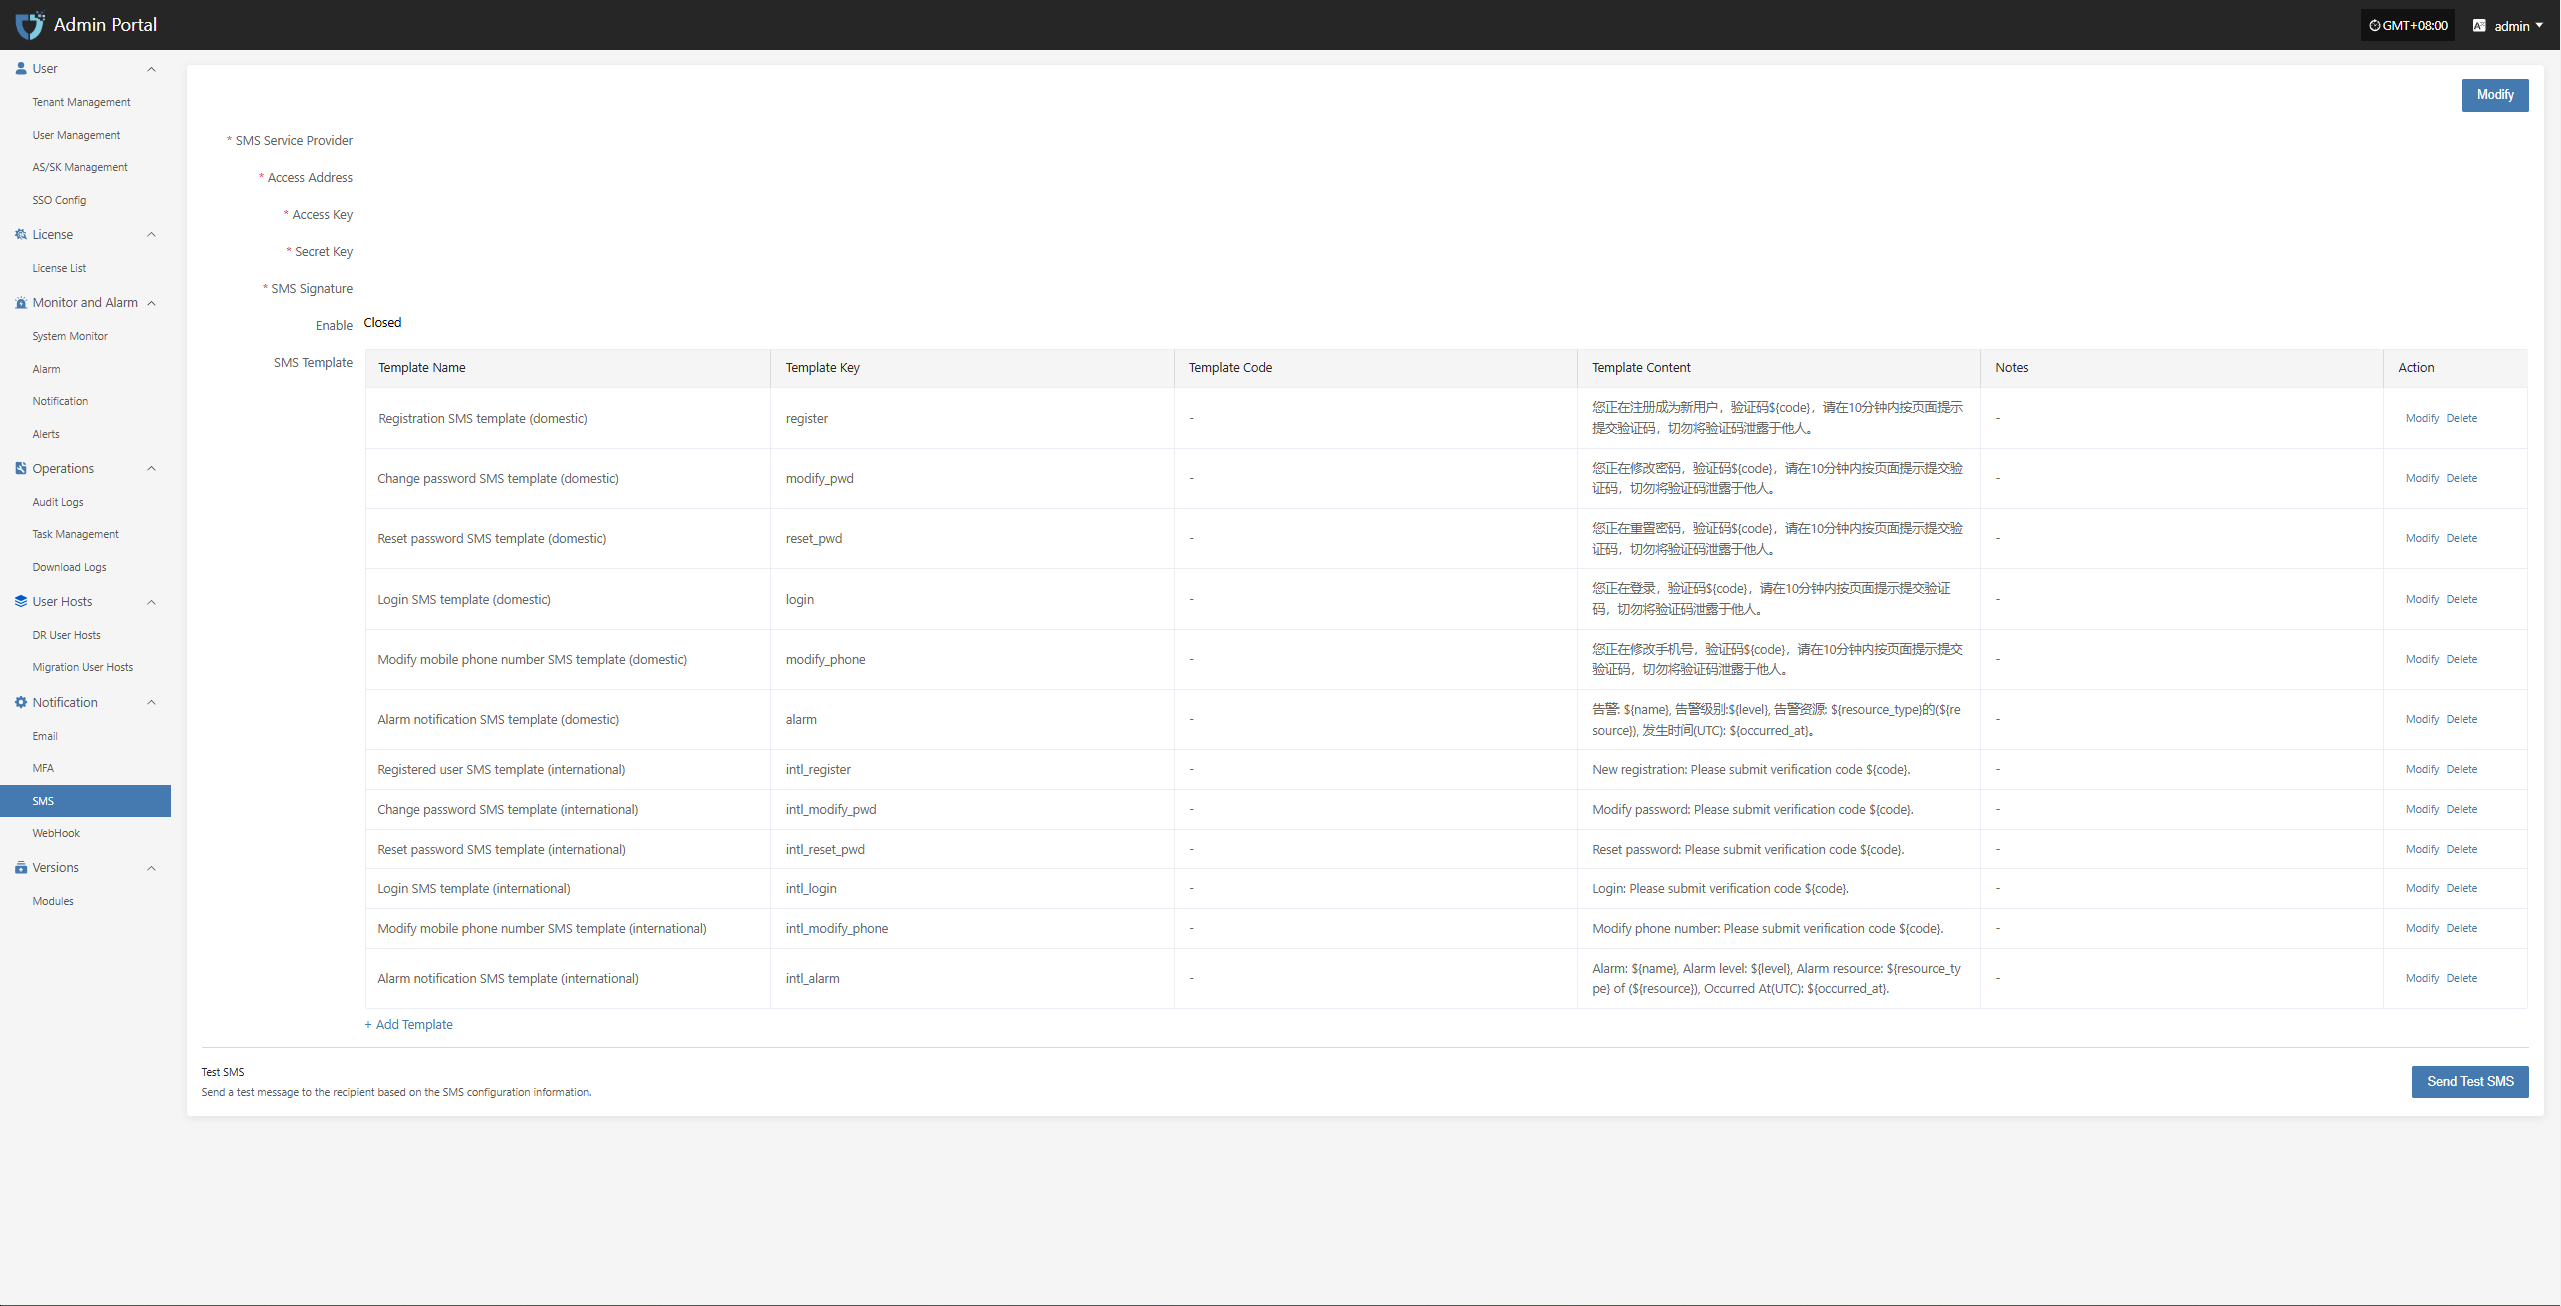
- SMS alarm channel
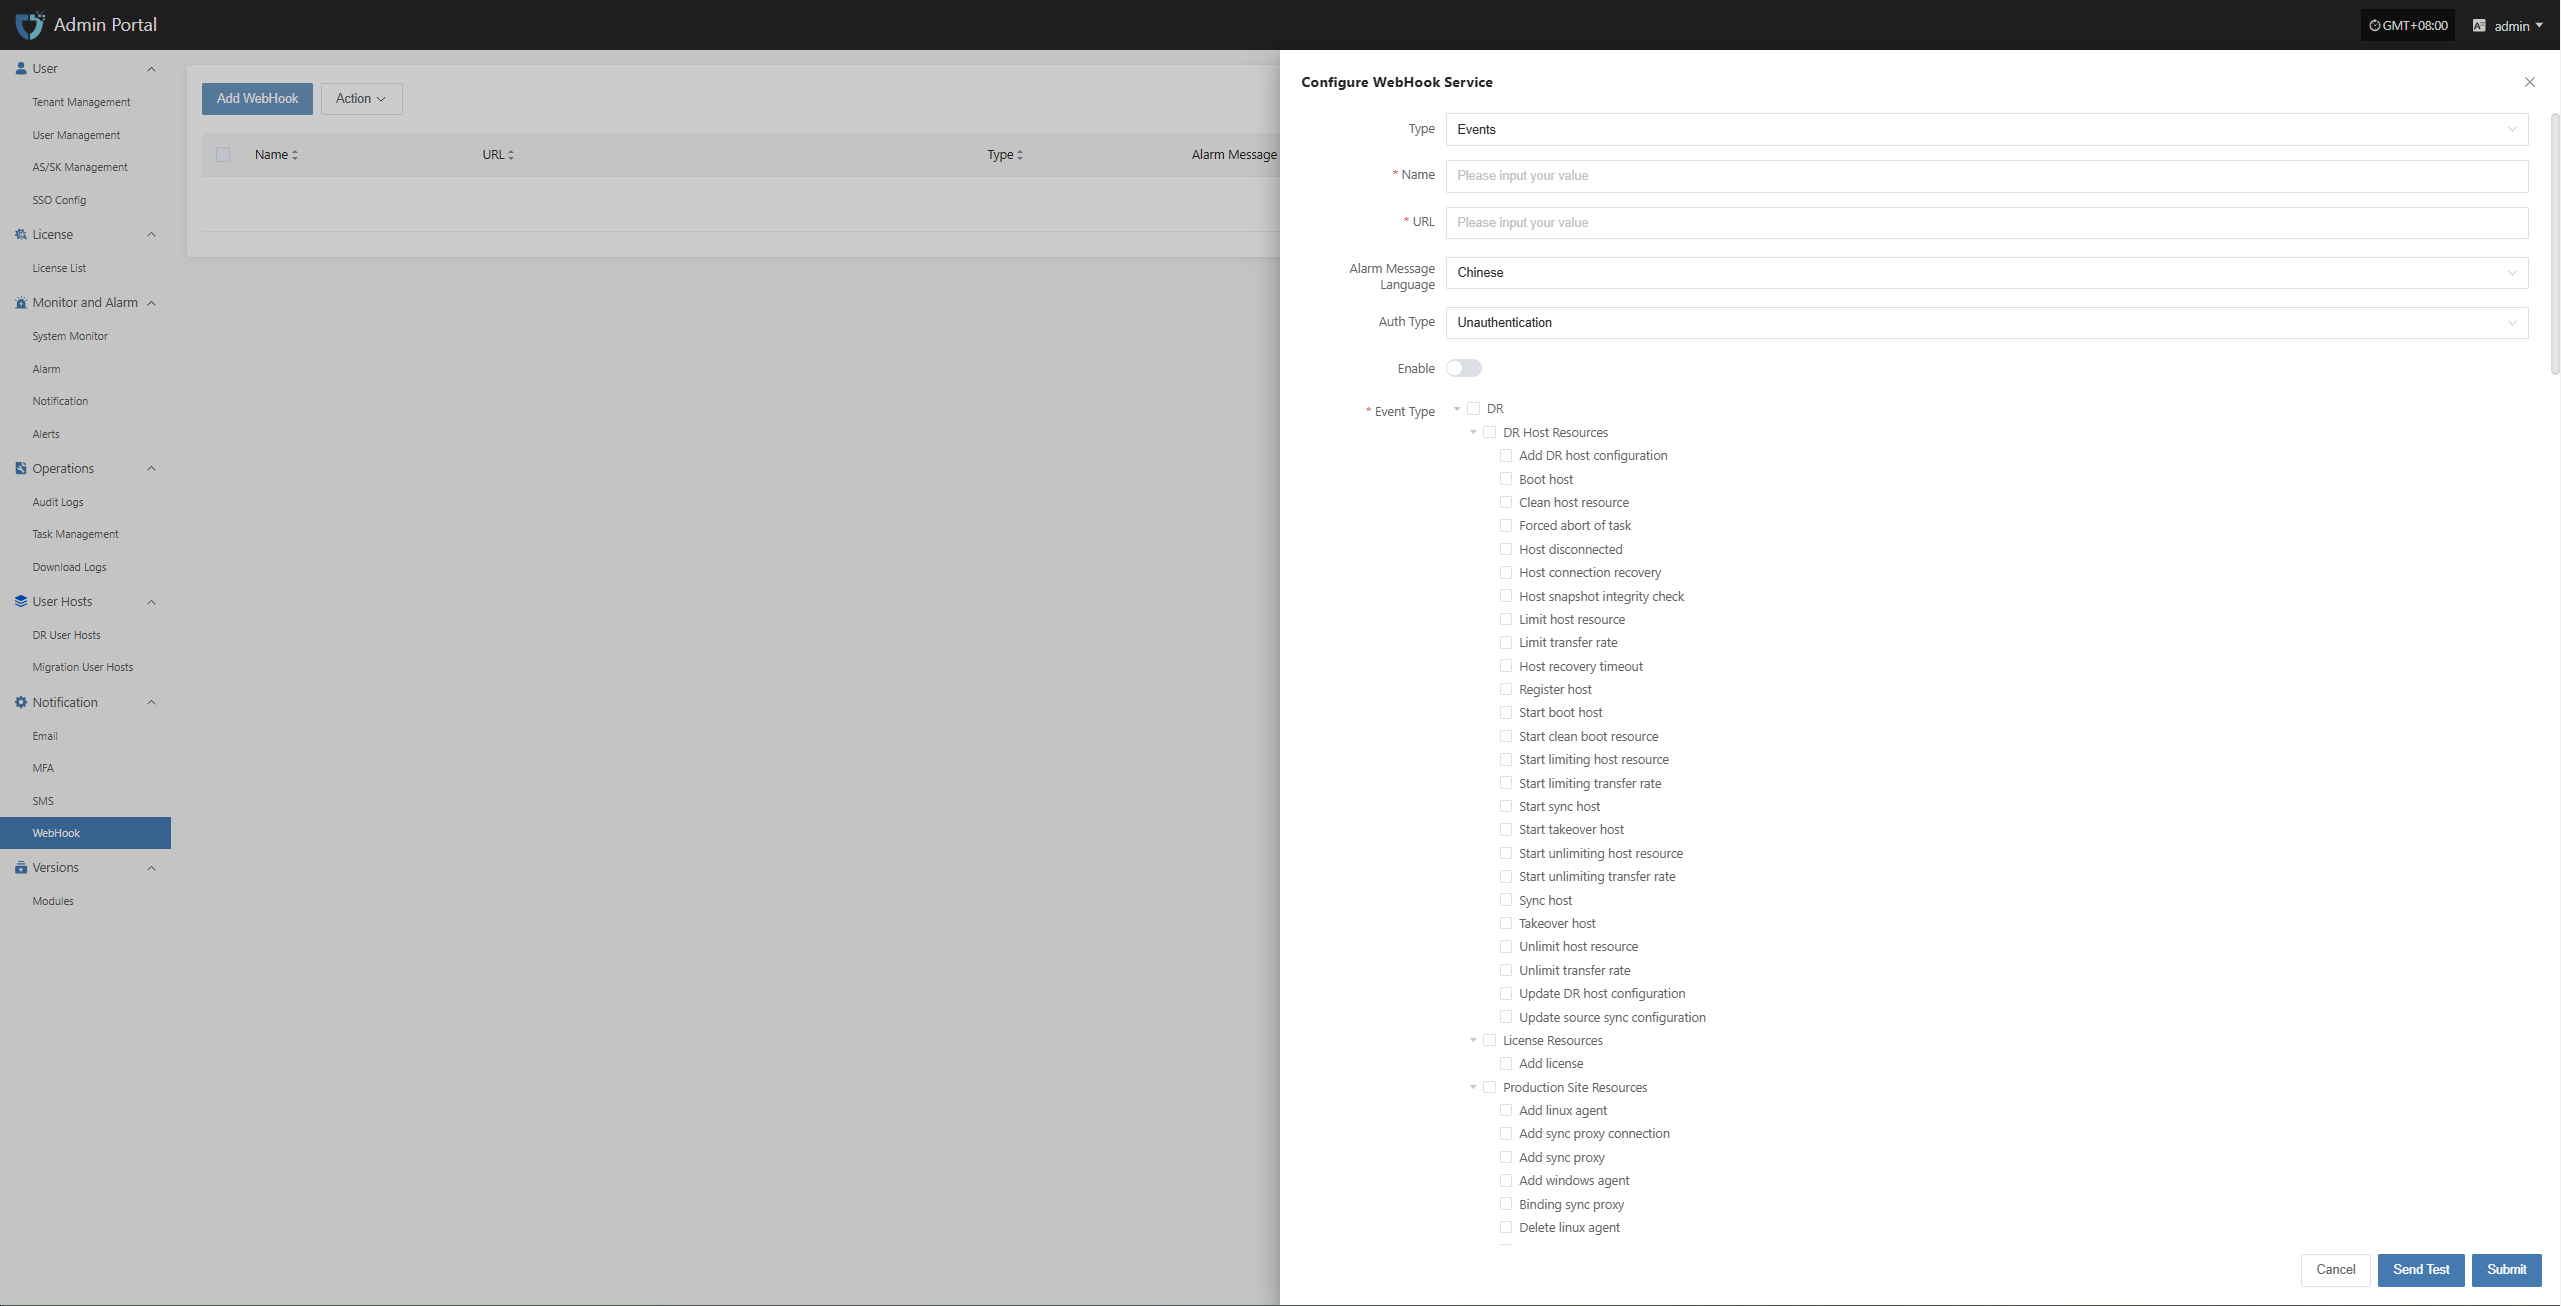
- WebHook alarm channel
Alarm Response Process
After receiving an alarm, O&M staff should investigate and handle the issue within the specified SLA time.
After processing, update the ticket system or logs to record the cause, steps, and result of the incident.
Alarm Best Practice
Resource Alarm
To ensure system stability and controllable resource usage, basic alarm thresholds have been set for key resources such as CPU, memory, and disk. When resource usage exceeds the preset warning value, the system will automatically trigger an alarm notification, allowing O&M personnel to respond and handle it in time to avoid resource bottlenecks affecting business operations.
| Resource Type | Alarm Metric | Alarm Rule | Alarm Level | Note |
|---|---|---|---|---|
| Host | CPU Usage | ≥ 80%, sustained for 5 min | Critical | |
| Host | Memory Usage Percentage | ≥ 80%, sustained for 5 min | Critical | |
| Host | Root Disk Usage Percentage | ≥ 80%, sustained for 5 min | Critical | |
| Host | Number of Unhealthy Containers | ≥ 1, sustained for 5 min | Critical | |
| RabbitMQ | Queue Message Count | ≥ 10, sustained for 5 min | Critical |
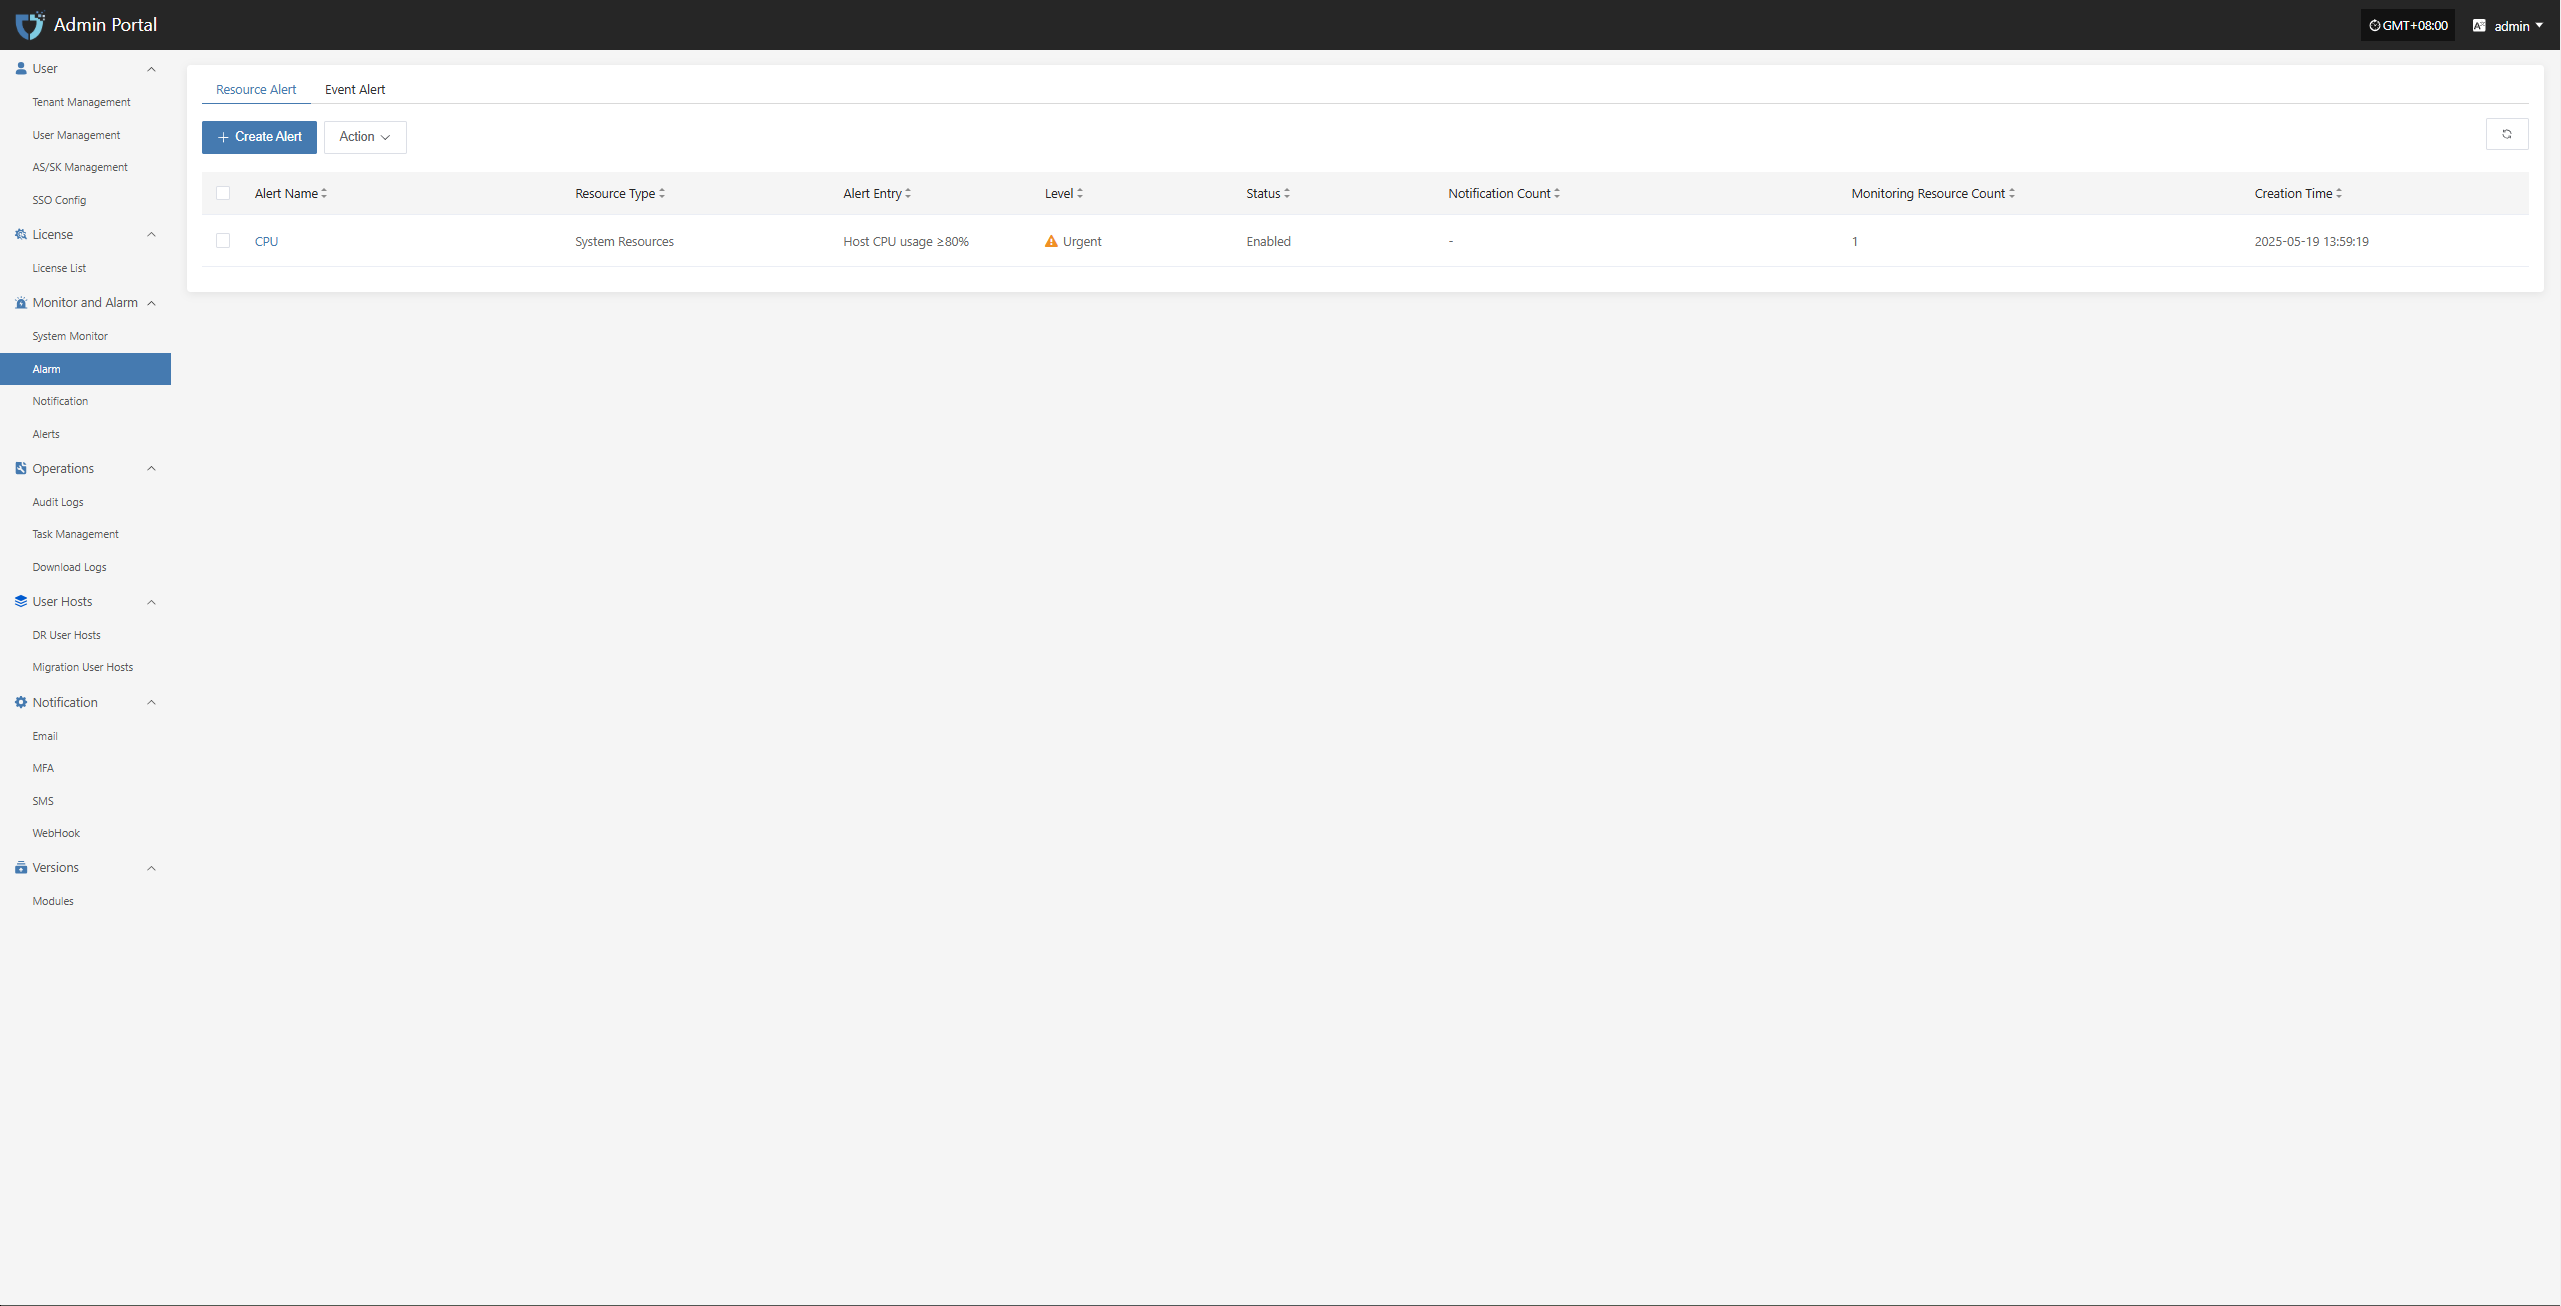
Configuration Example: CPU Resource Alarm
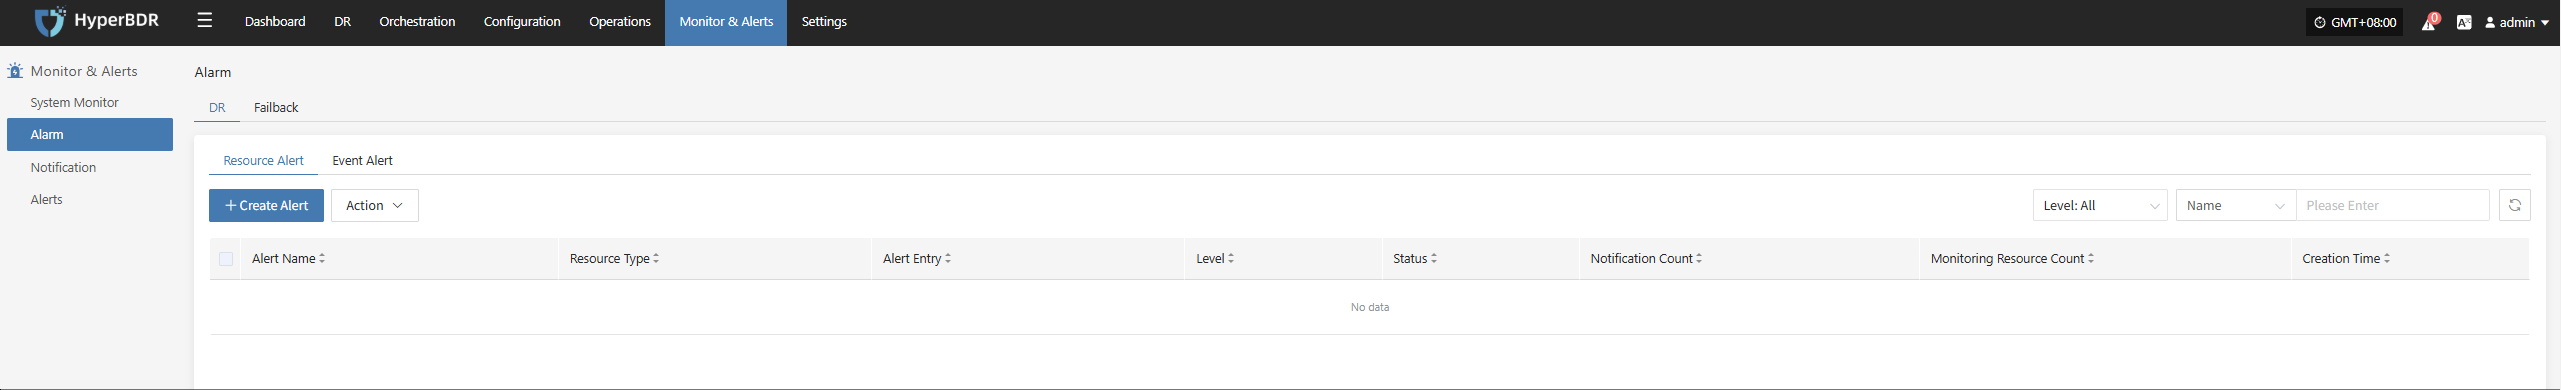
Log in to the O&M management platform: IP:30443

Monitor and Alarm -- Alarm -- Resource Alert -- Create Alert
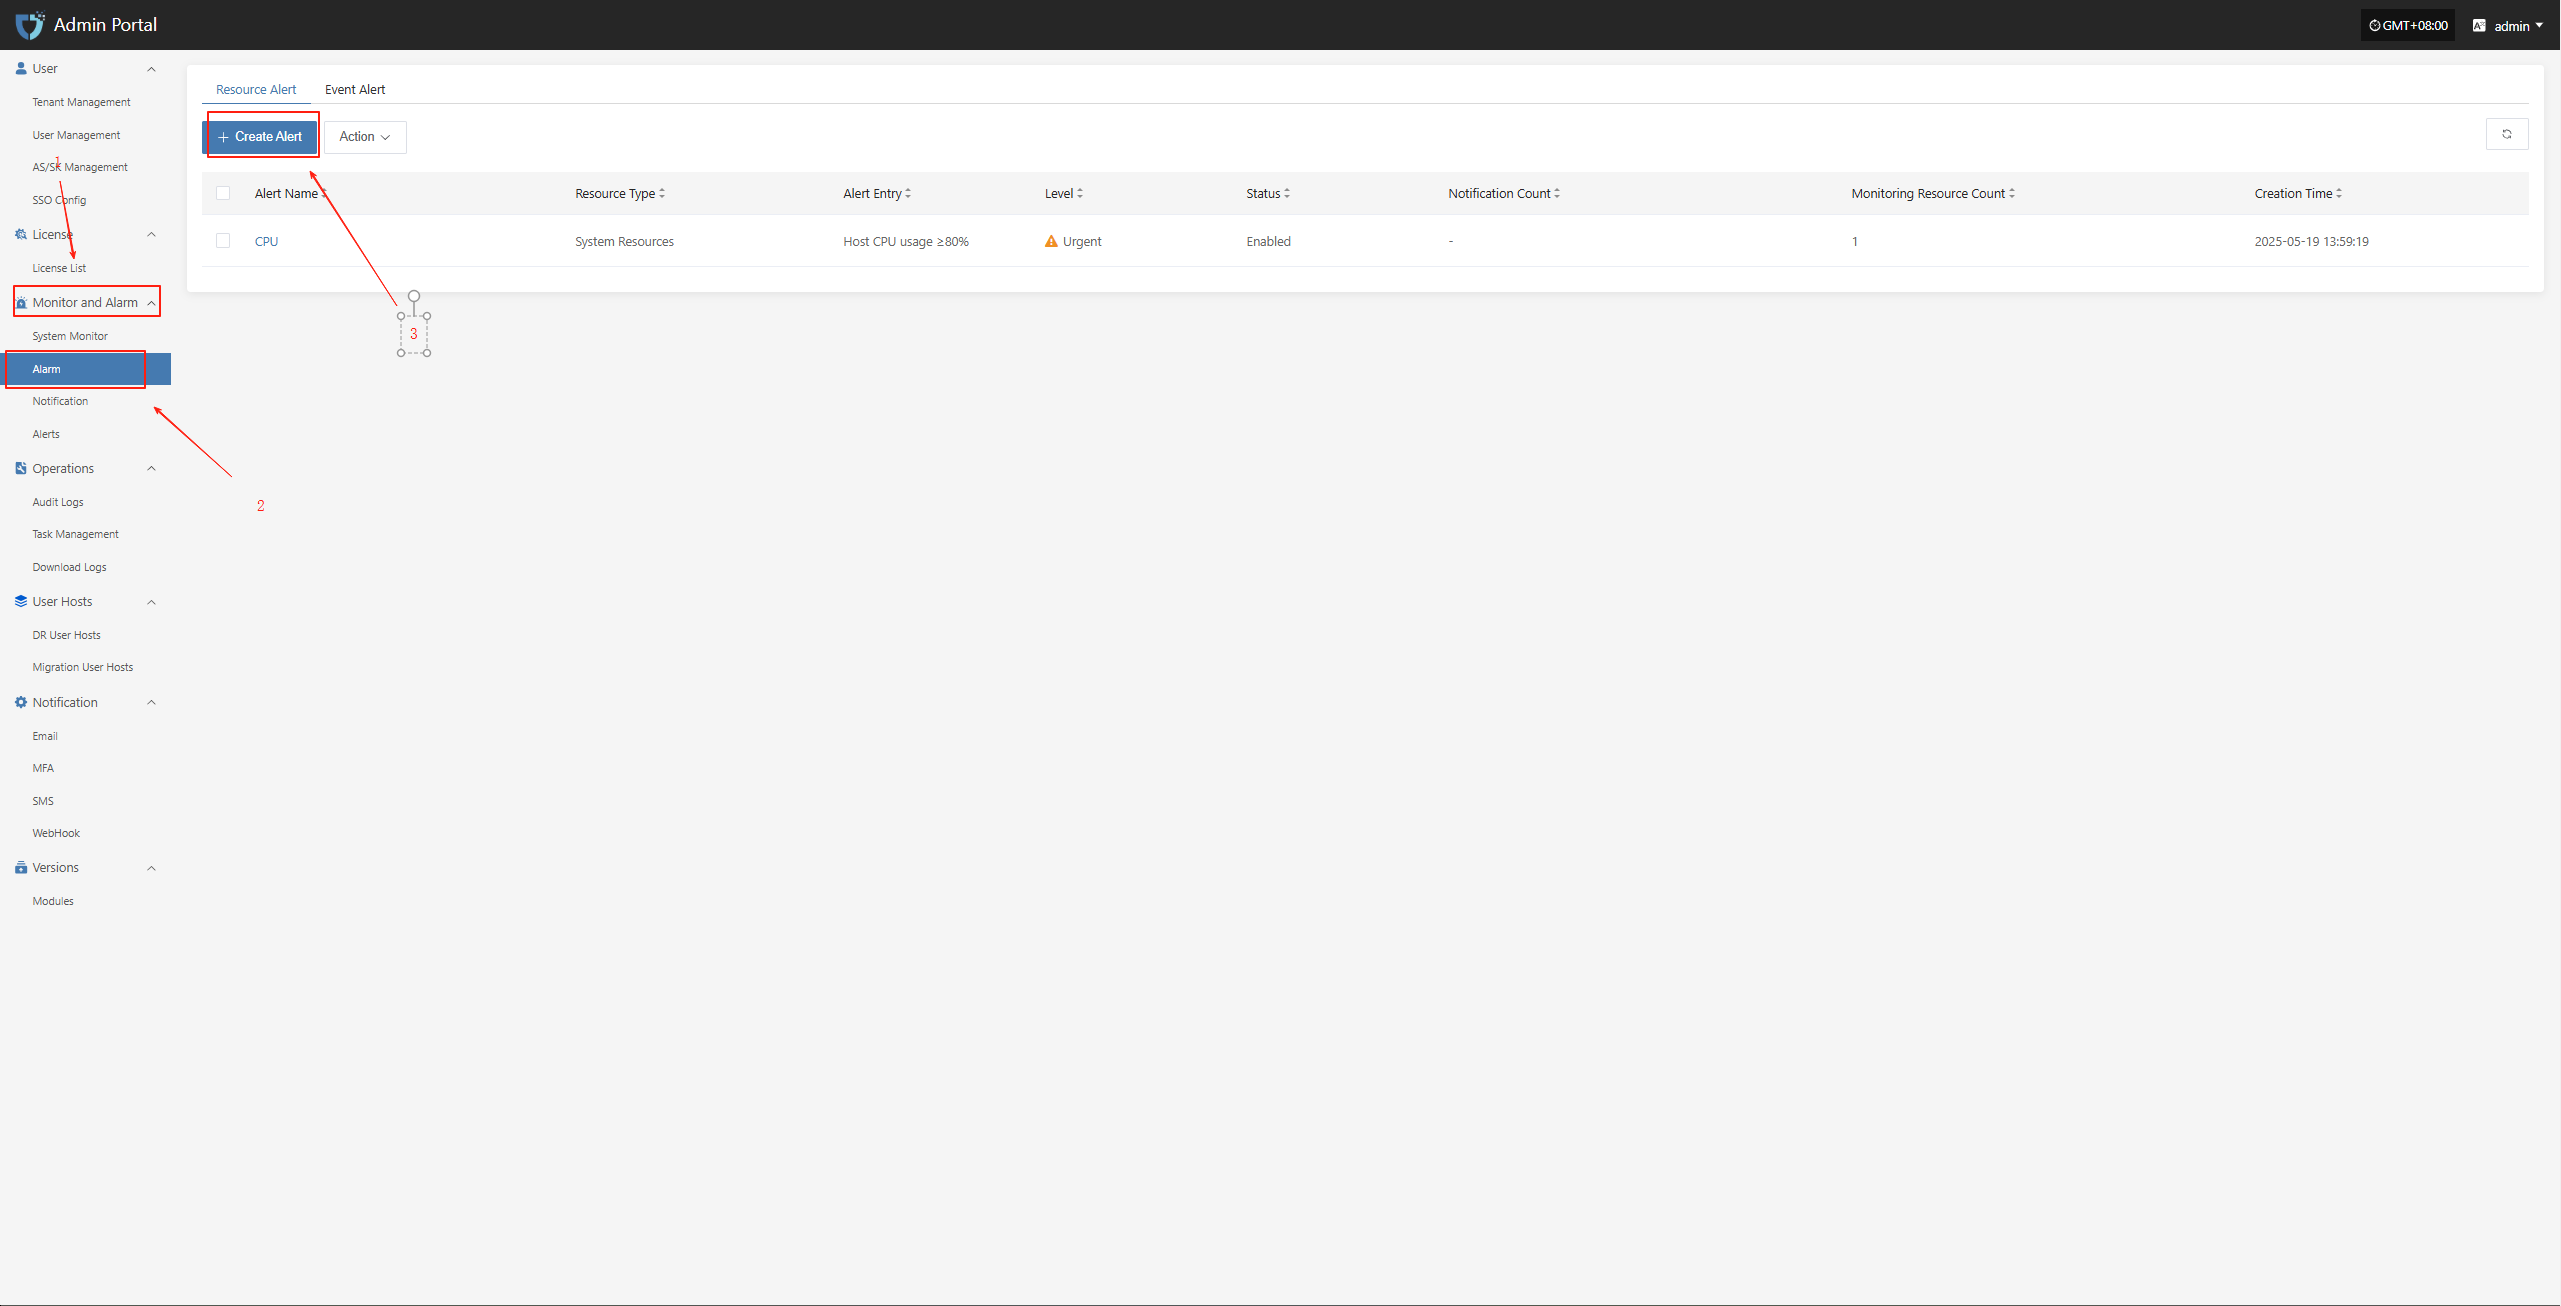
Fill in the corresponding level name as needed, and clarify the monitoring scope according to the table above
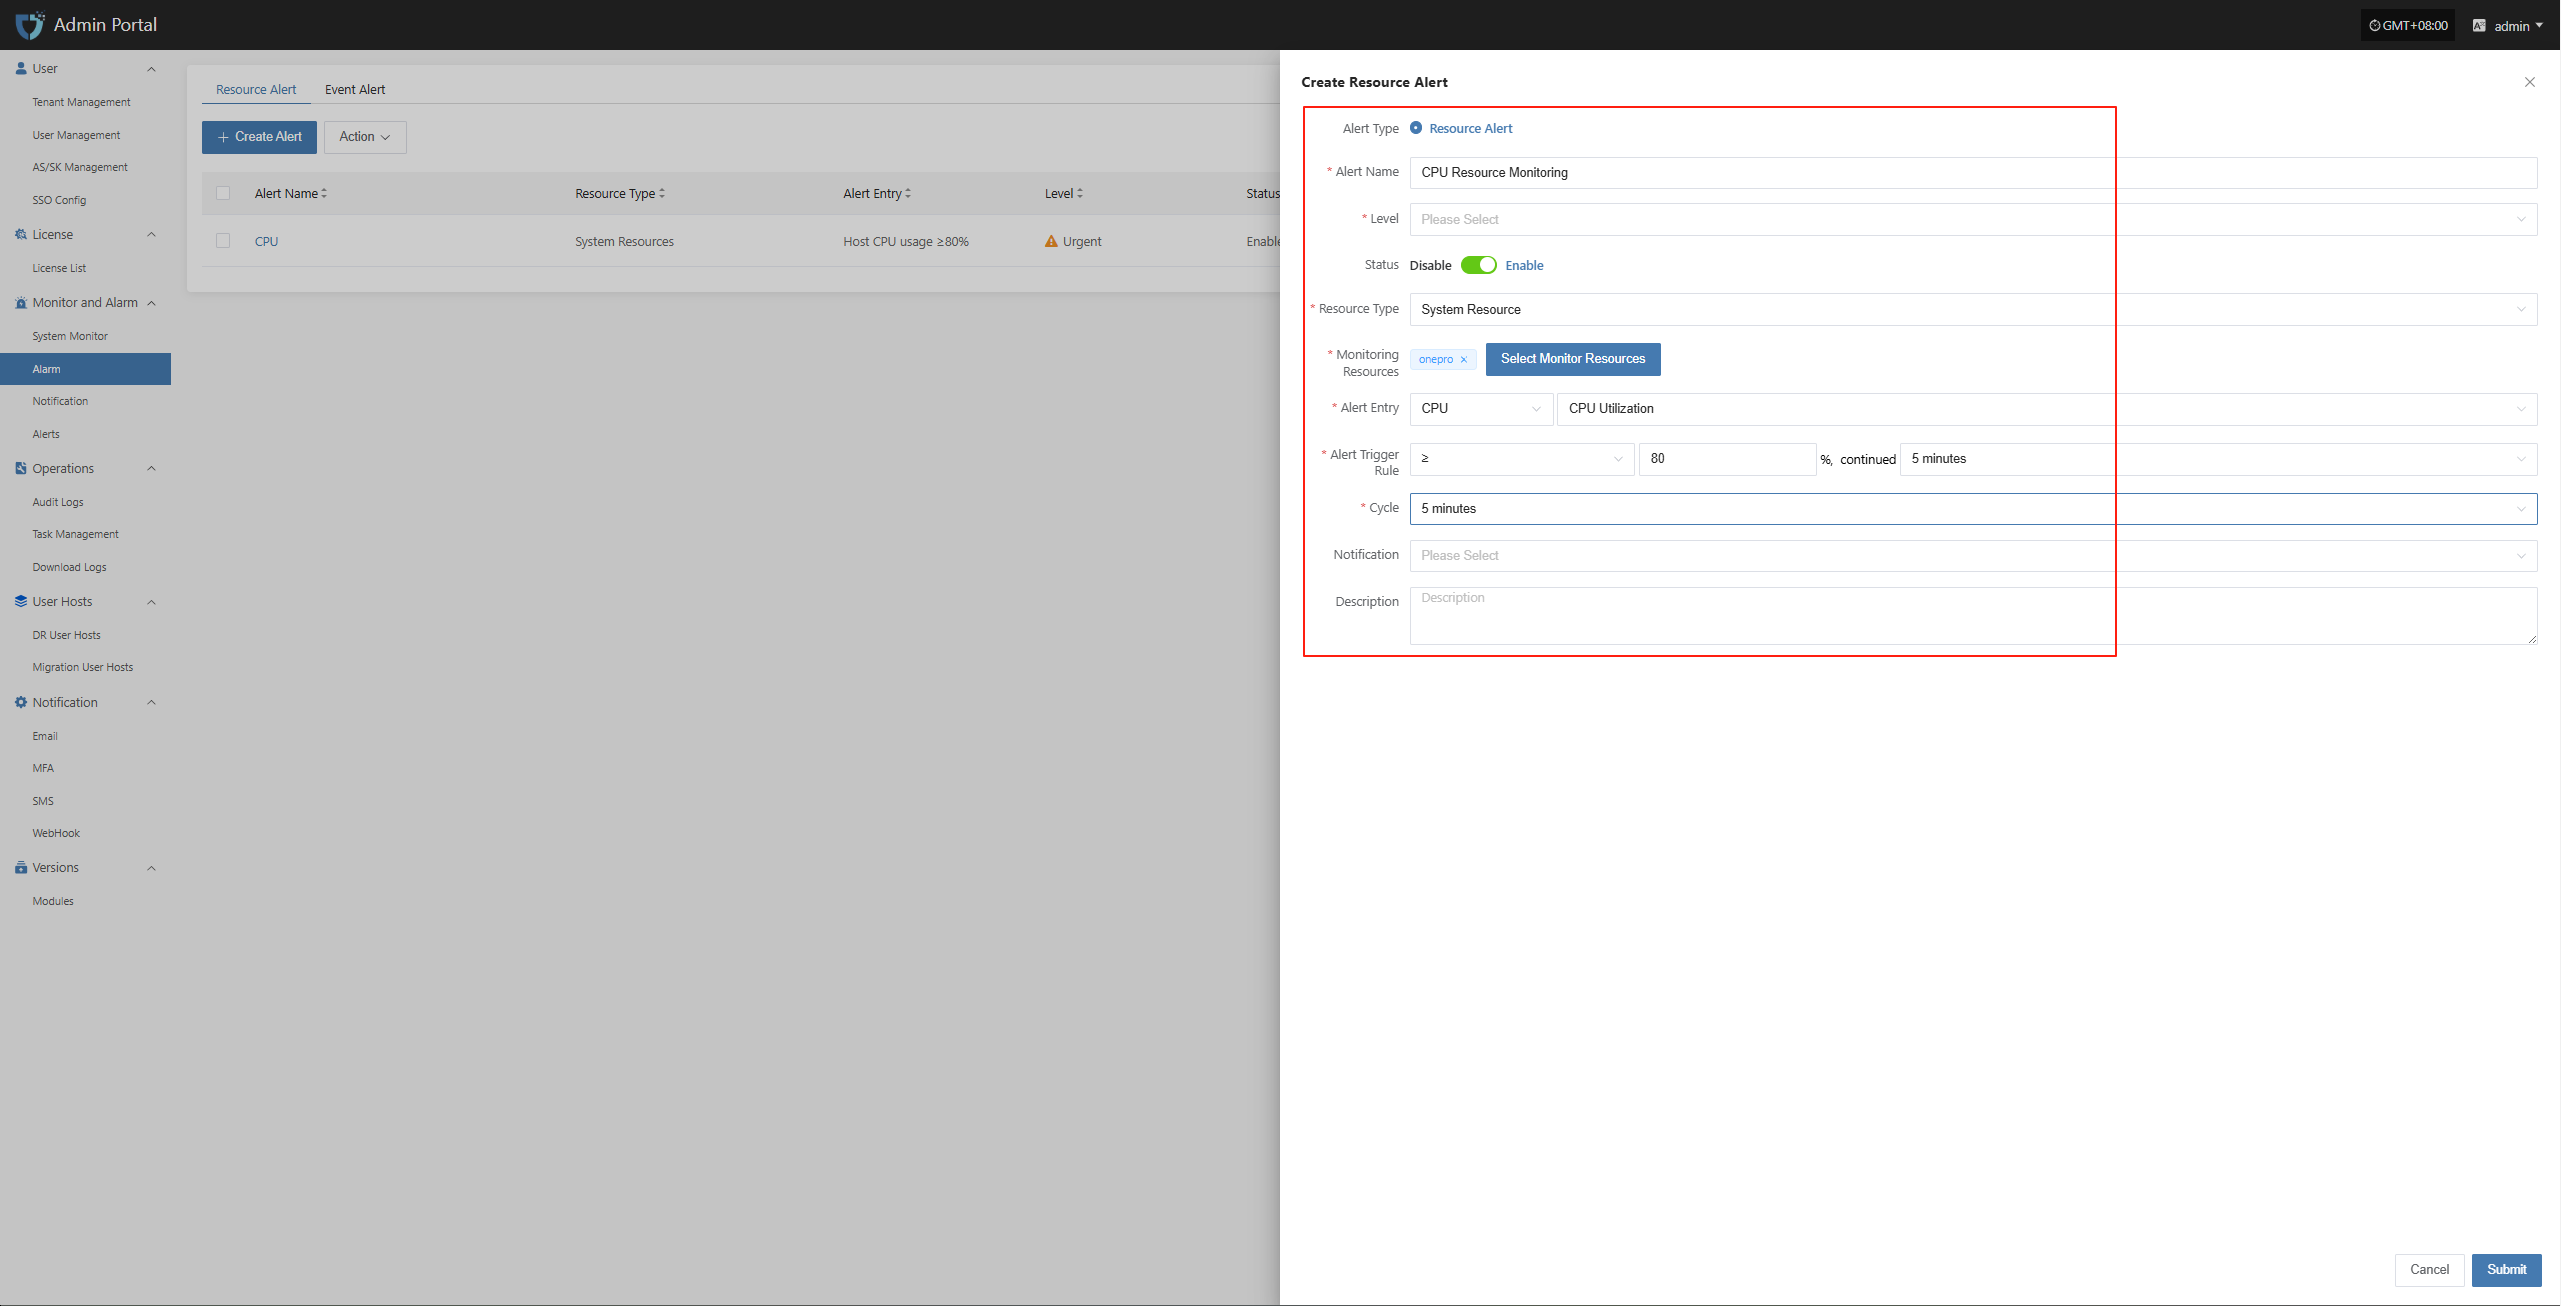
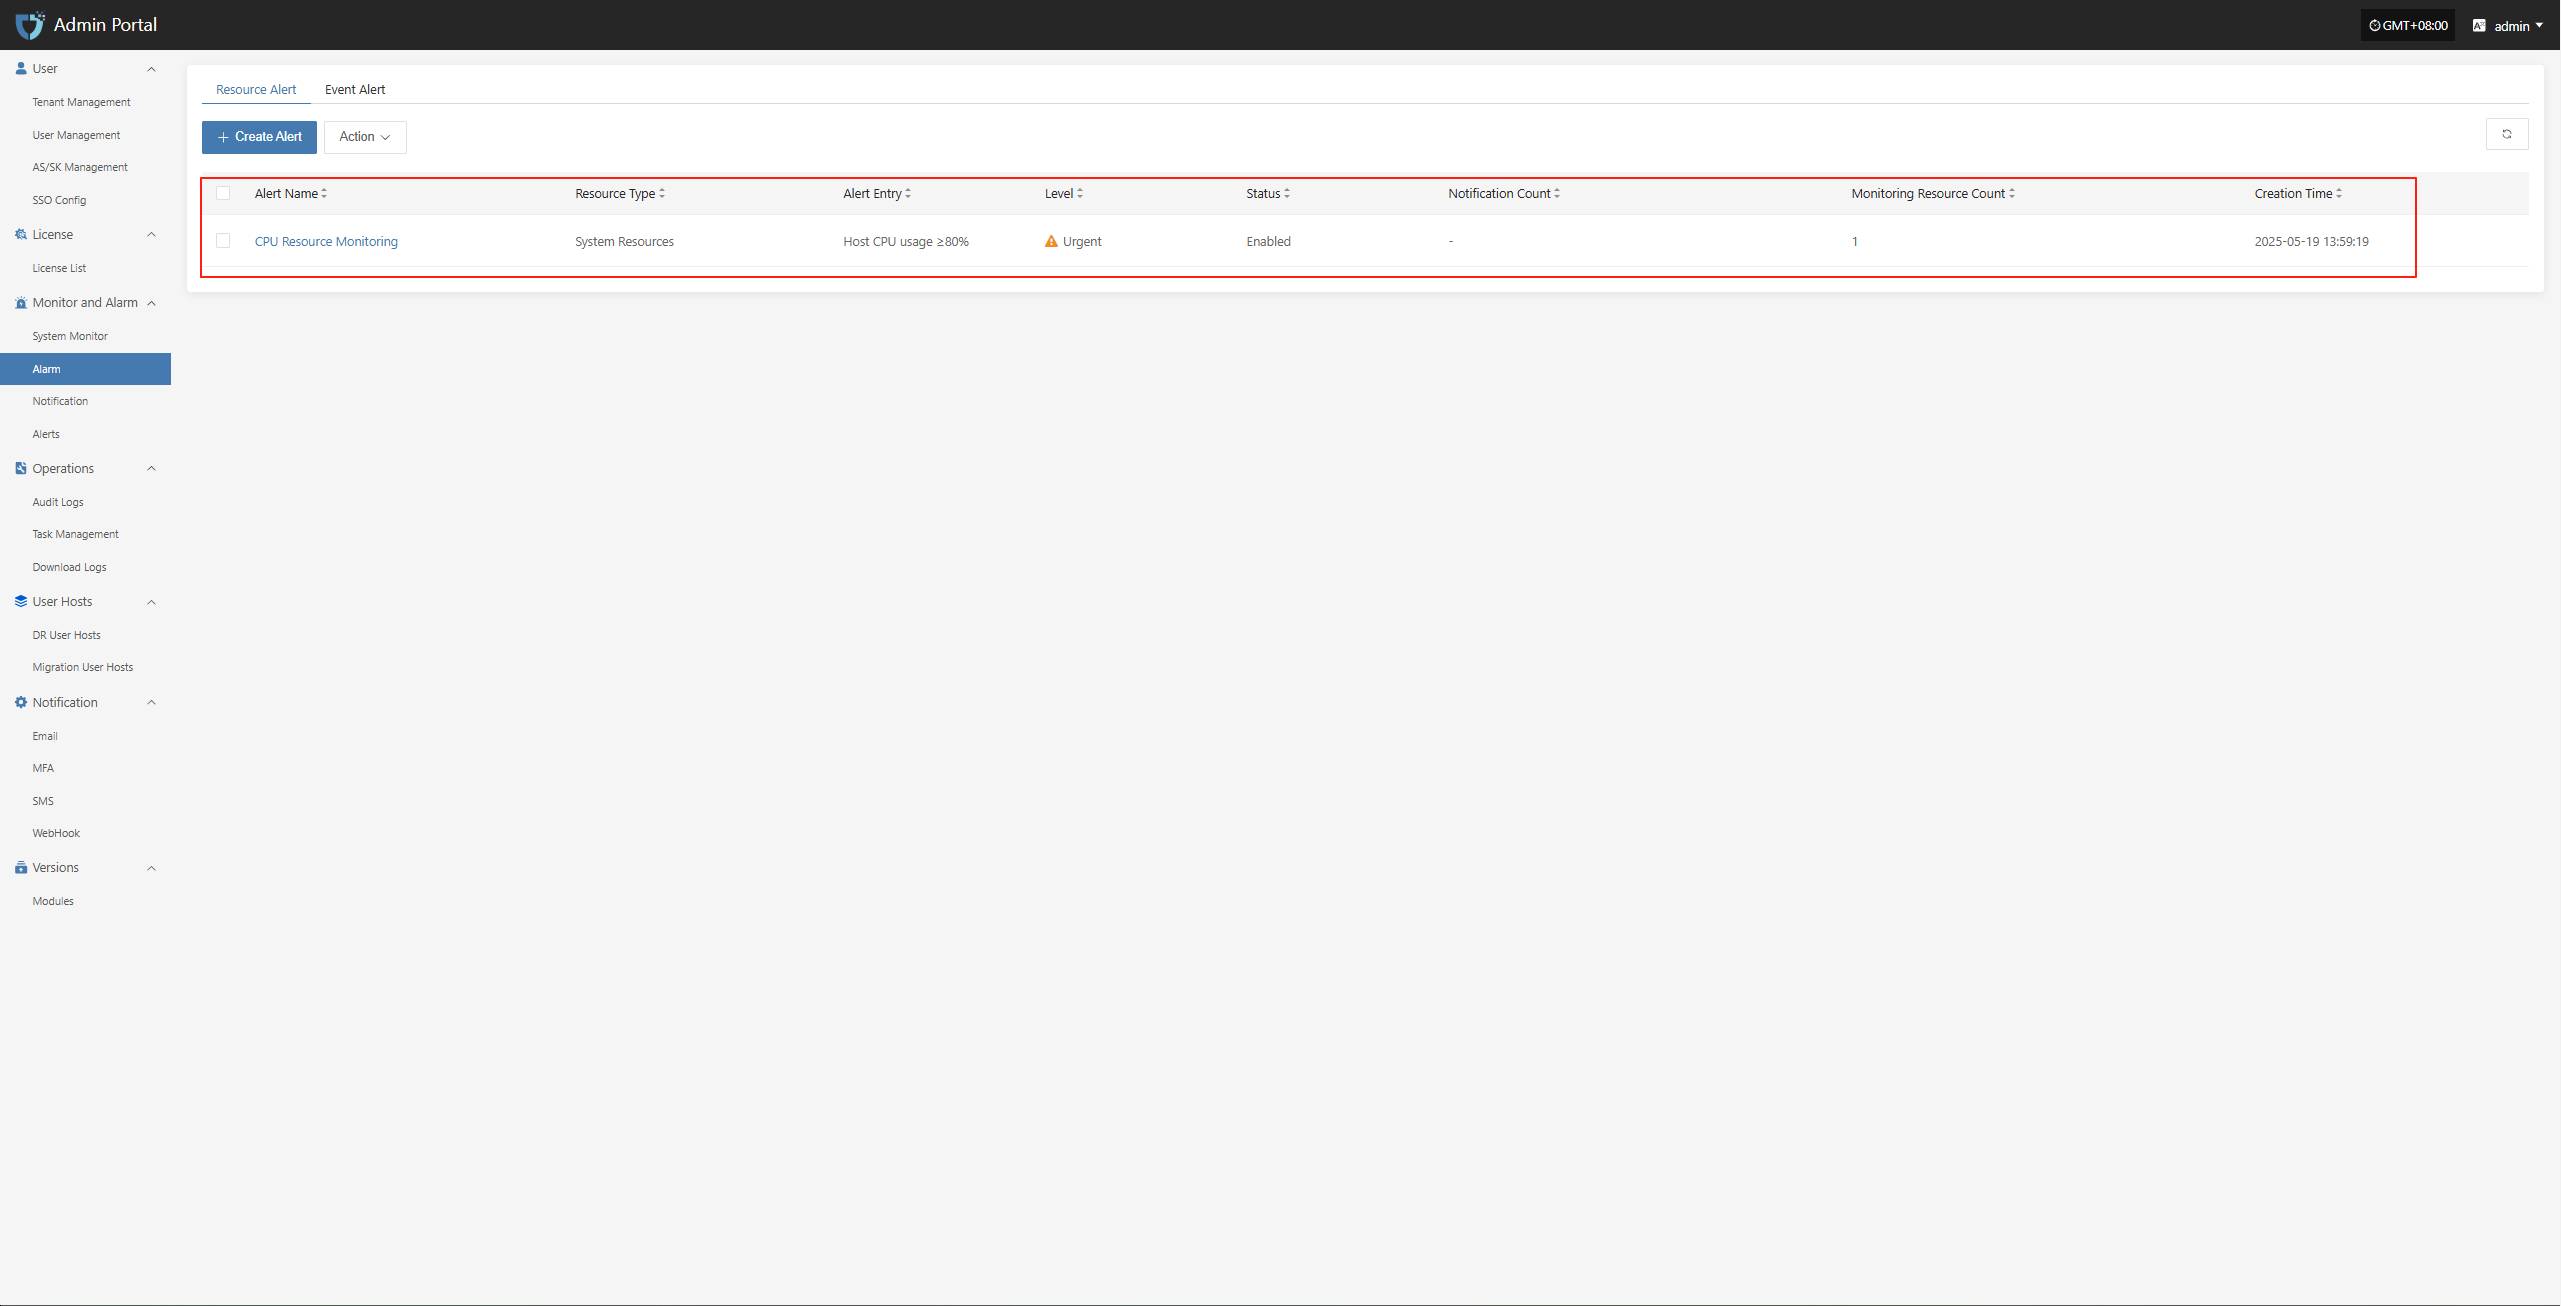
Complete the creation
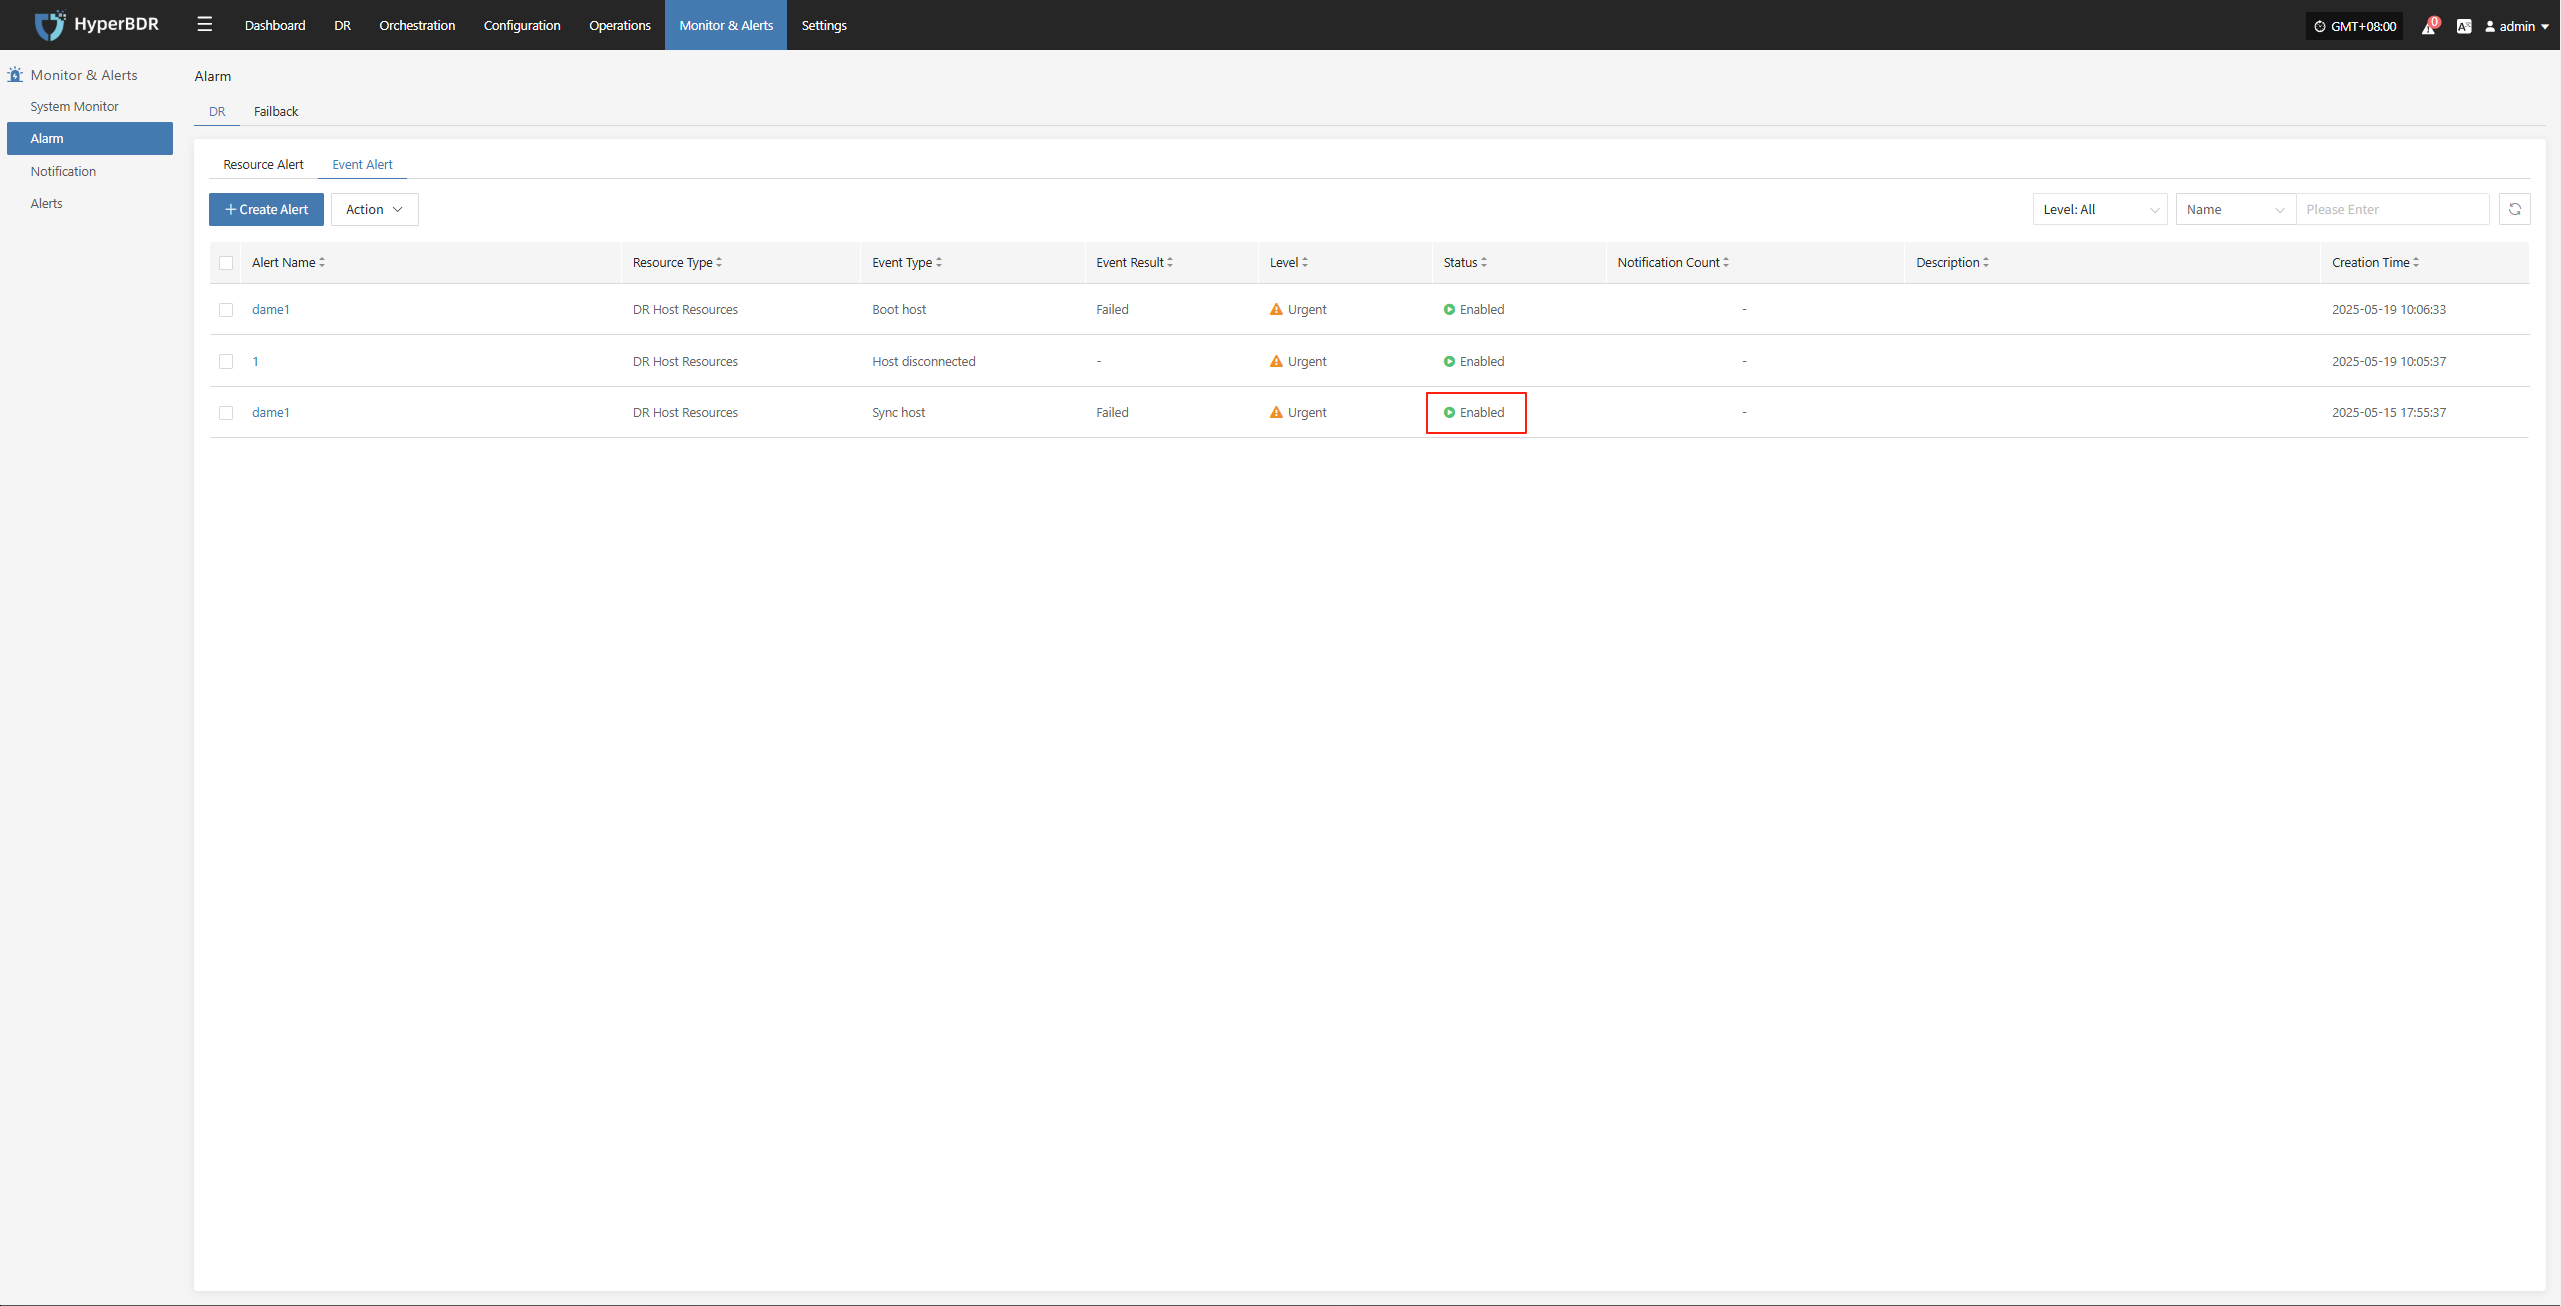
Event Alarm
To ensure the security and observability of system operations, event monitoring strategies have been set for key operational behaviors and abnormal states of DR hosts. When events such as host disconnection, sync failure, or startup exception are detected, the system will automatically record and trigger alarm notifications to help O&M personnel quickly locate and handle issues, reducing the impact of potential risks on business.
| Monitored Resource | Event Type | Event Result | Alarm Level | Note |
|---|---|---|---|---|
| Event | Host Disconnected | Success | Critical | |
| Event | Sync Host | Failure | Critical | |
| Event | Boot Host | Failure | Critical |
Configuration Example: Sync Data Failure Alarm
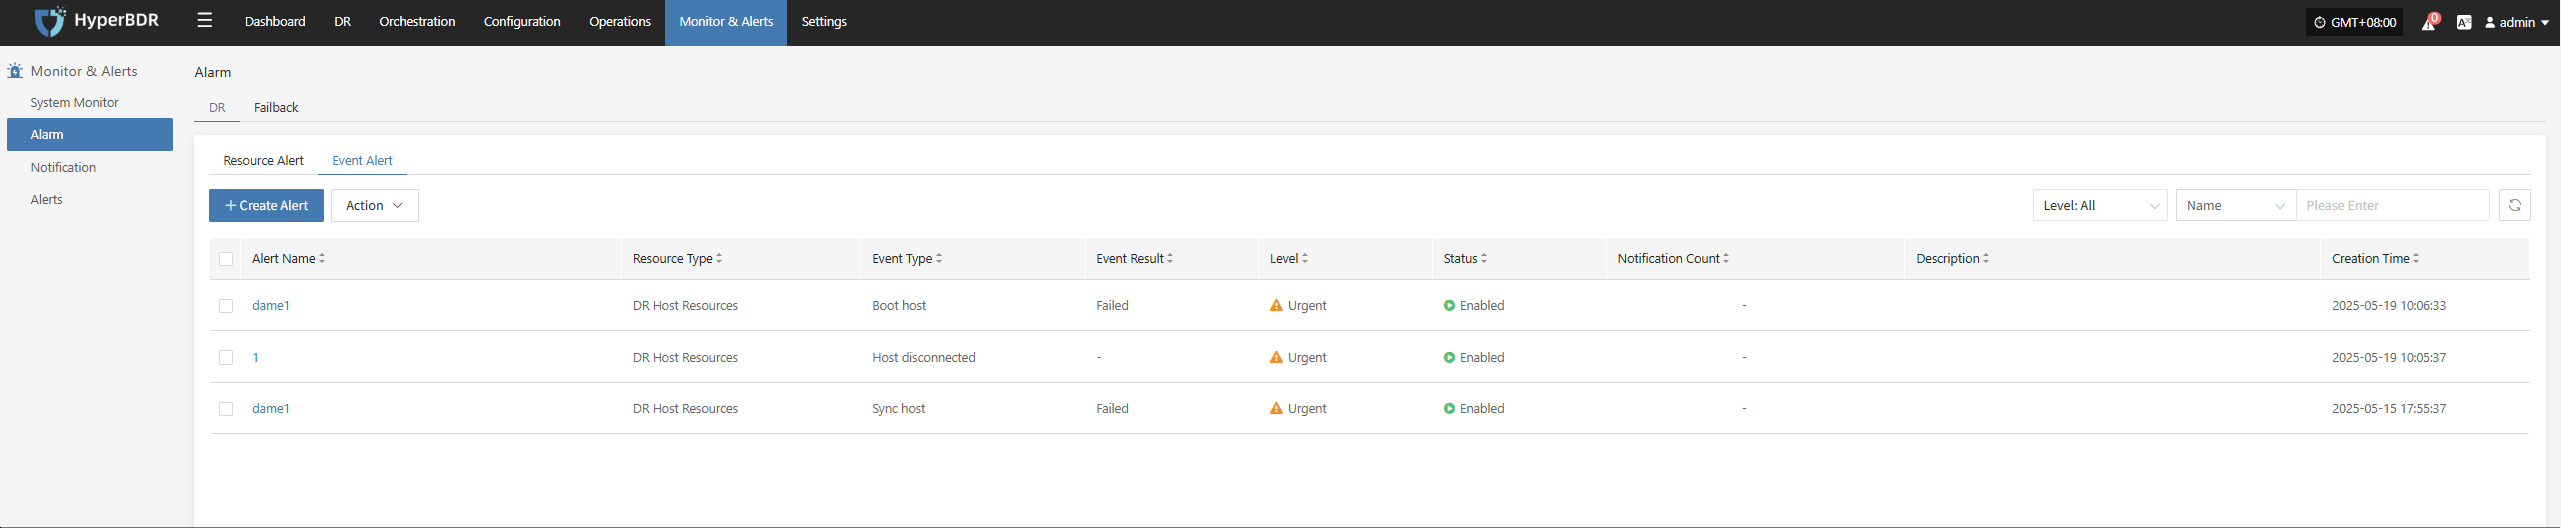
Log in to the console: IP:30443
Monitor & Alerts -- Alarm -- Event Alert -- Create Alerts
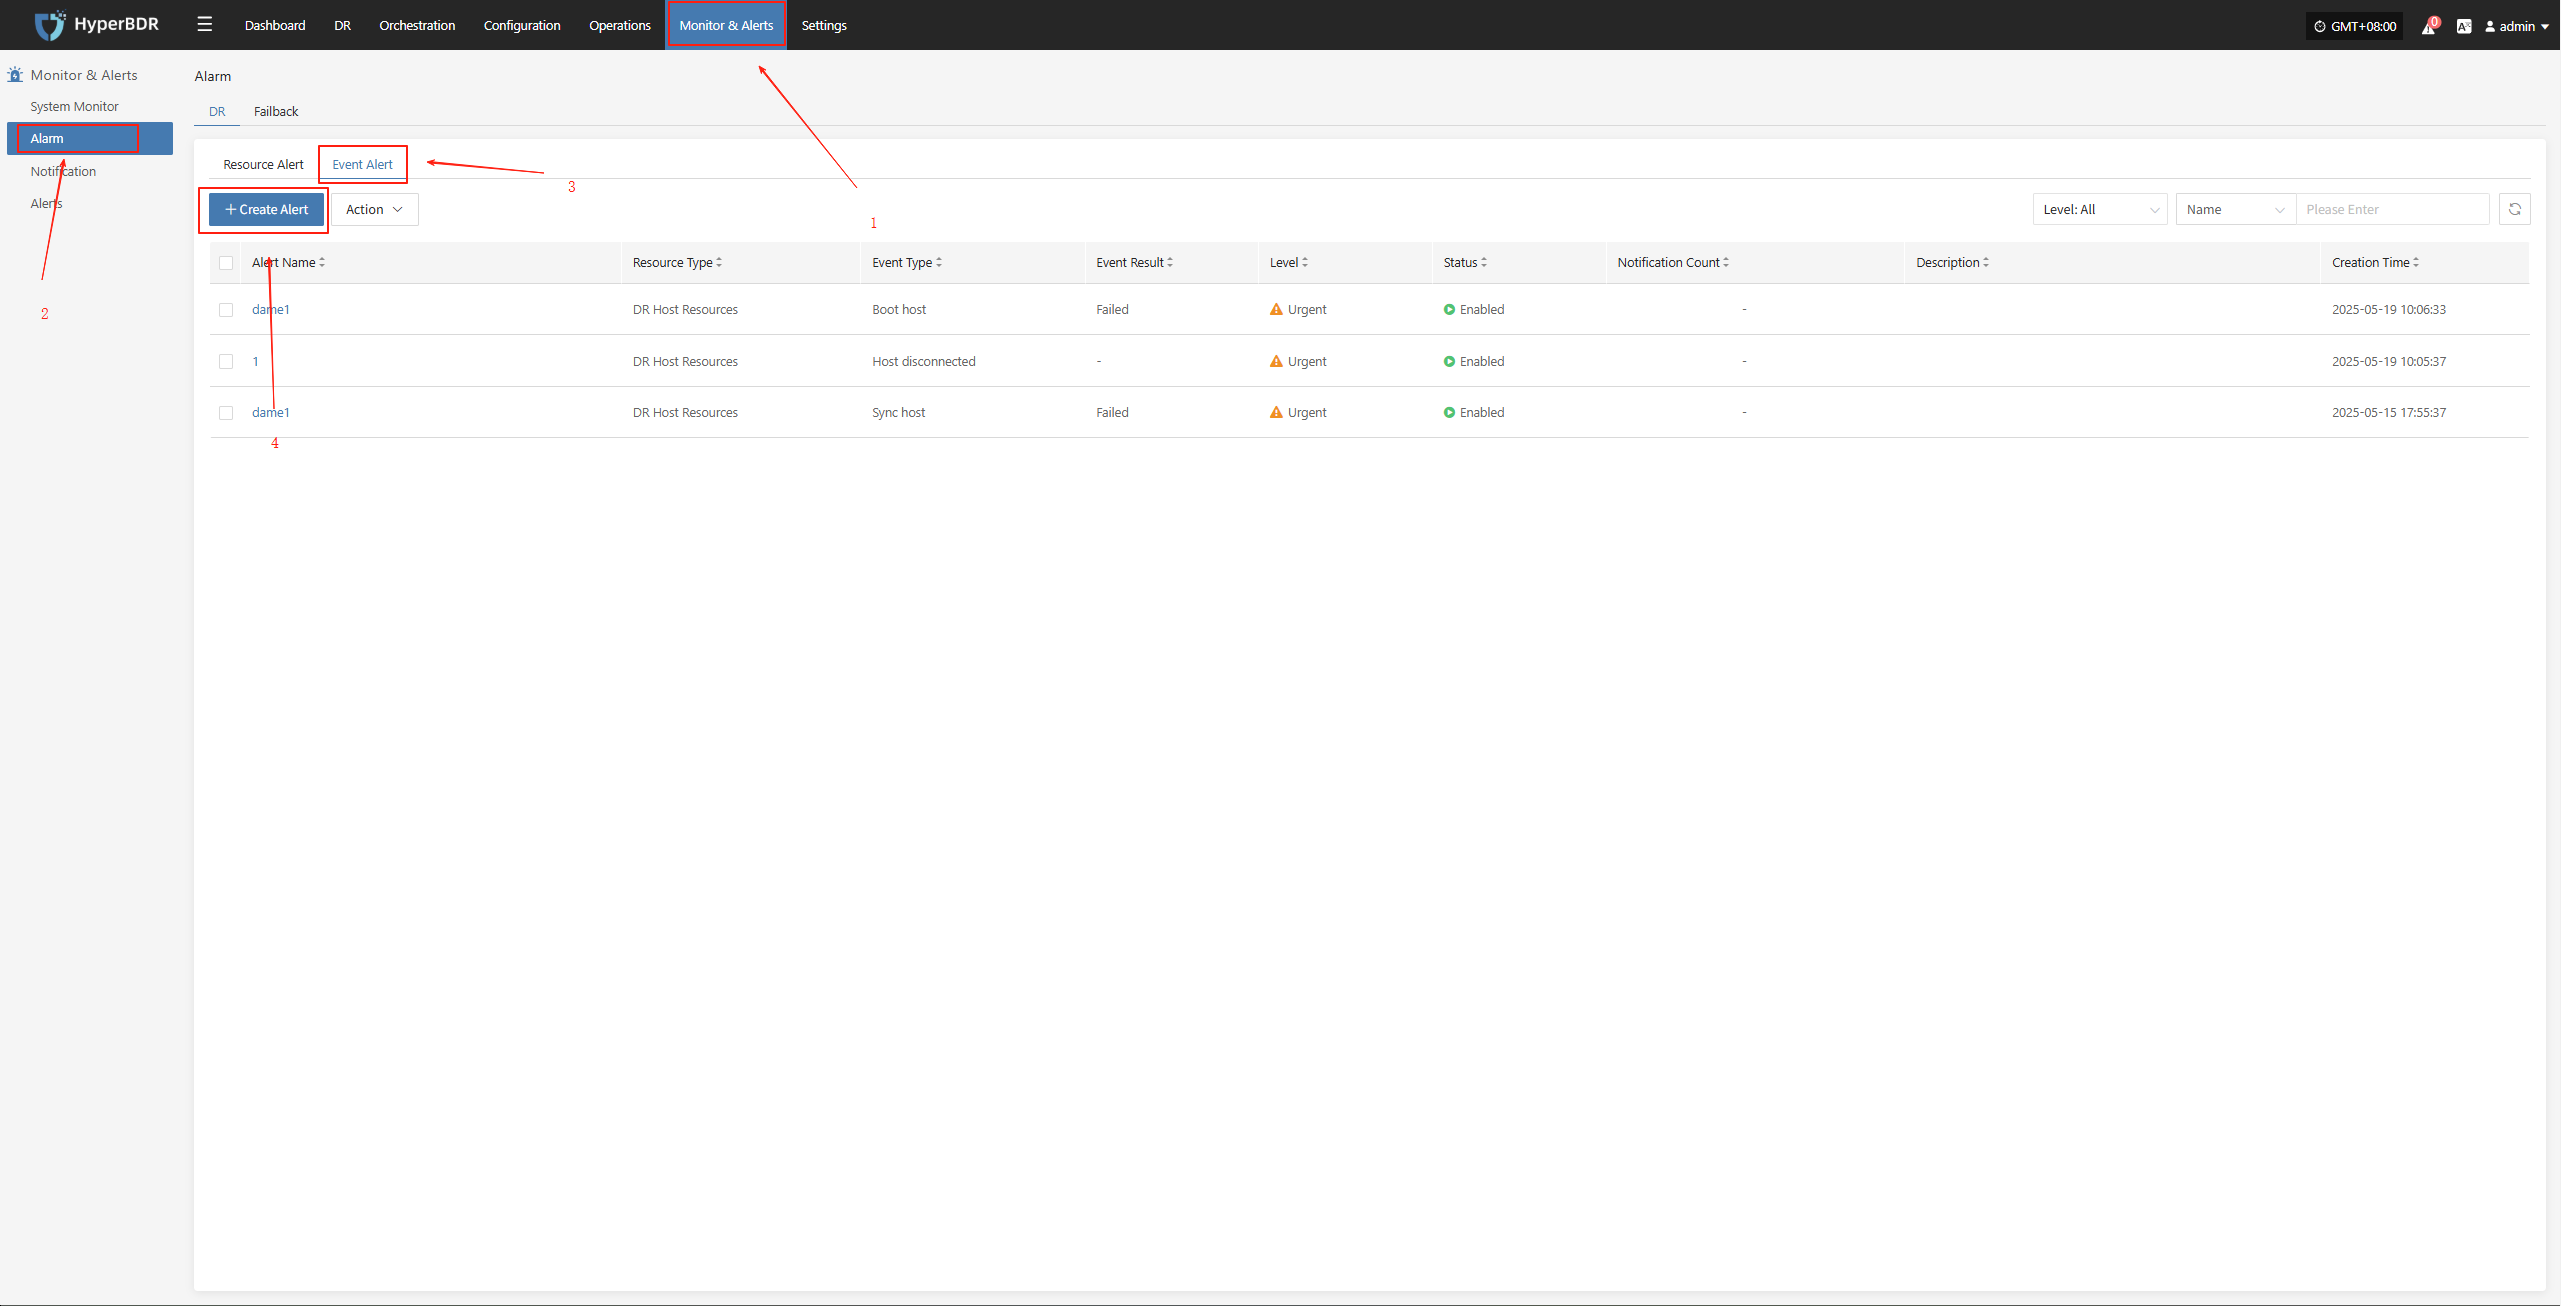
Select and fill in the corresponding monitored event type as needed
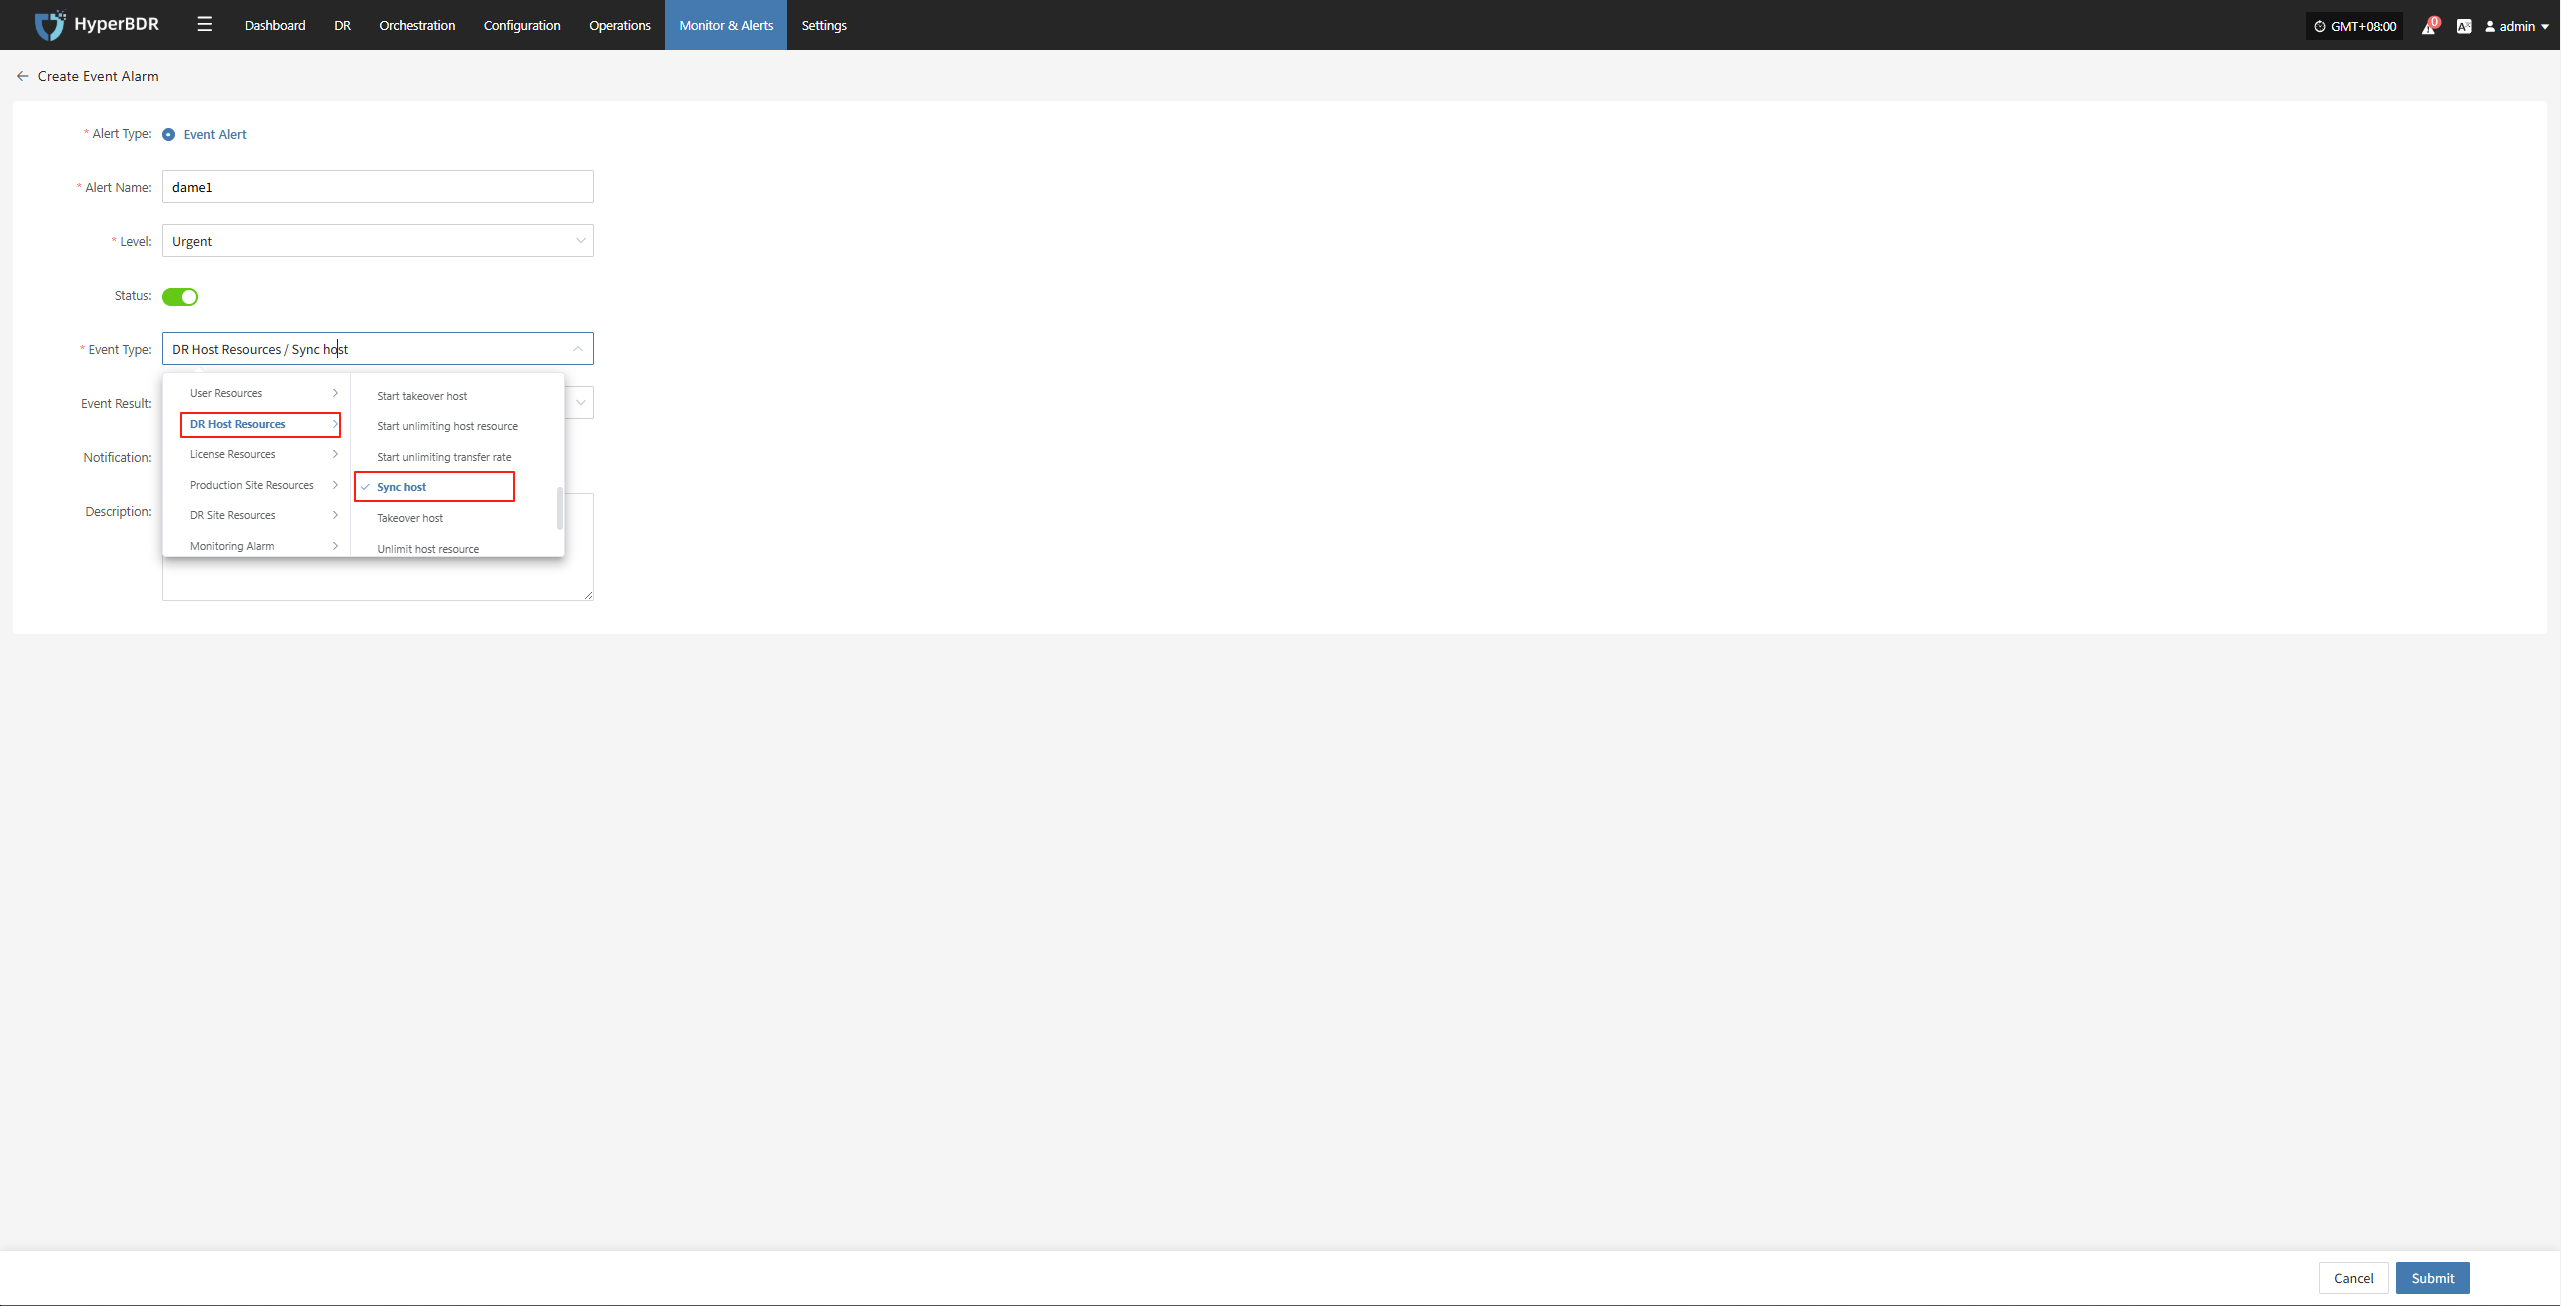
Specify the event result type

Complete the creation
Usage Scenarios
Troubleshooting Sudden Backup Failures: Use the monitoring dashboard to check task logs, system resource usage, and network status to locate the fault point.
Performance Bottleneck Analysis: Analyze historical metric trends to determine whether to increase bandwidth, upgrade server configurations, or optimize backup strategies.
Disaster Recovery Drill Observation: During disaster recovery drills, use the overview and real-time monitoring to track recovery task progress and resource usage.
DR Drill
Drill Preparation
Disaster recovery drills are a critical step to ensure the actual availability of the DR system. It is recommended to conduct a full-process drill quarterly or at least every six months.
Drill Objectives and Scope
Clearly define which business systems, data types, and RPO/RTO targets the drill should cover.
Determine the drill scenarios, such as simulating data center power outages, core network failures, or regional cloud platform outages.
Resource Reservation
Prepare the necessary target environment resources for the drill (cloud hosts, storage, network configurations, etc.).
Ensure that the drill does not affect normal production operations. Use a test environment or reserved DR resources if possible.
Notification and Approval
Notify relevant business units, management, and O&M teams in advance to obtain the drill time window and authorization.
Develop drill scripts and rollback plans to ensure the drill can be terminated and the original state restored in case of unexpected situations.
Drill Process
Trigger a Disaster Scenario
Manually or via script, simulate failures such as stopping the source server, power outage, or network isolation.
Confirm that monitoring alerts are triggered correctly and that the HyperBDR console displays the fault information in real time.
Start the Disaster Recovery Drill Process
- In the HyperBDR console, select the corresponding DR host, click "Drill," choose the recovery point in time, and restore the DR host to the target environment with one click.
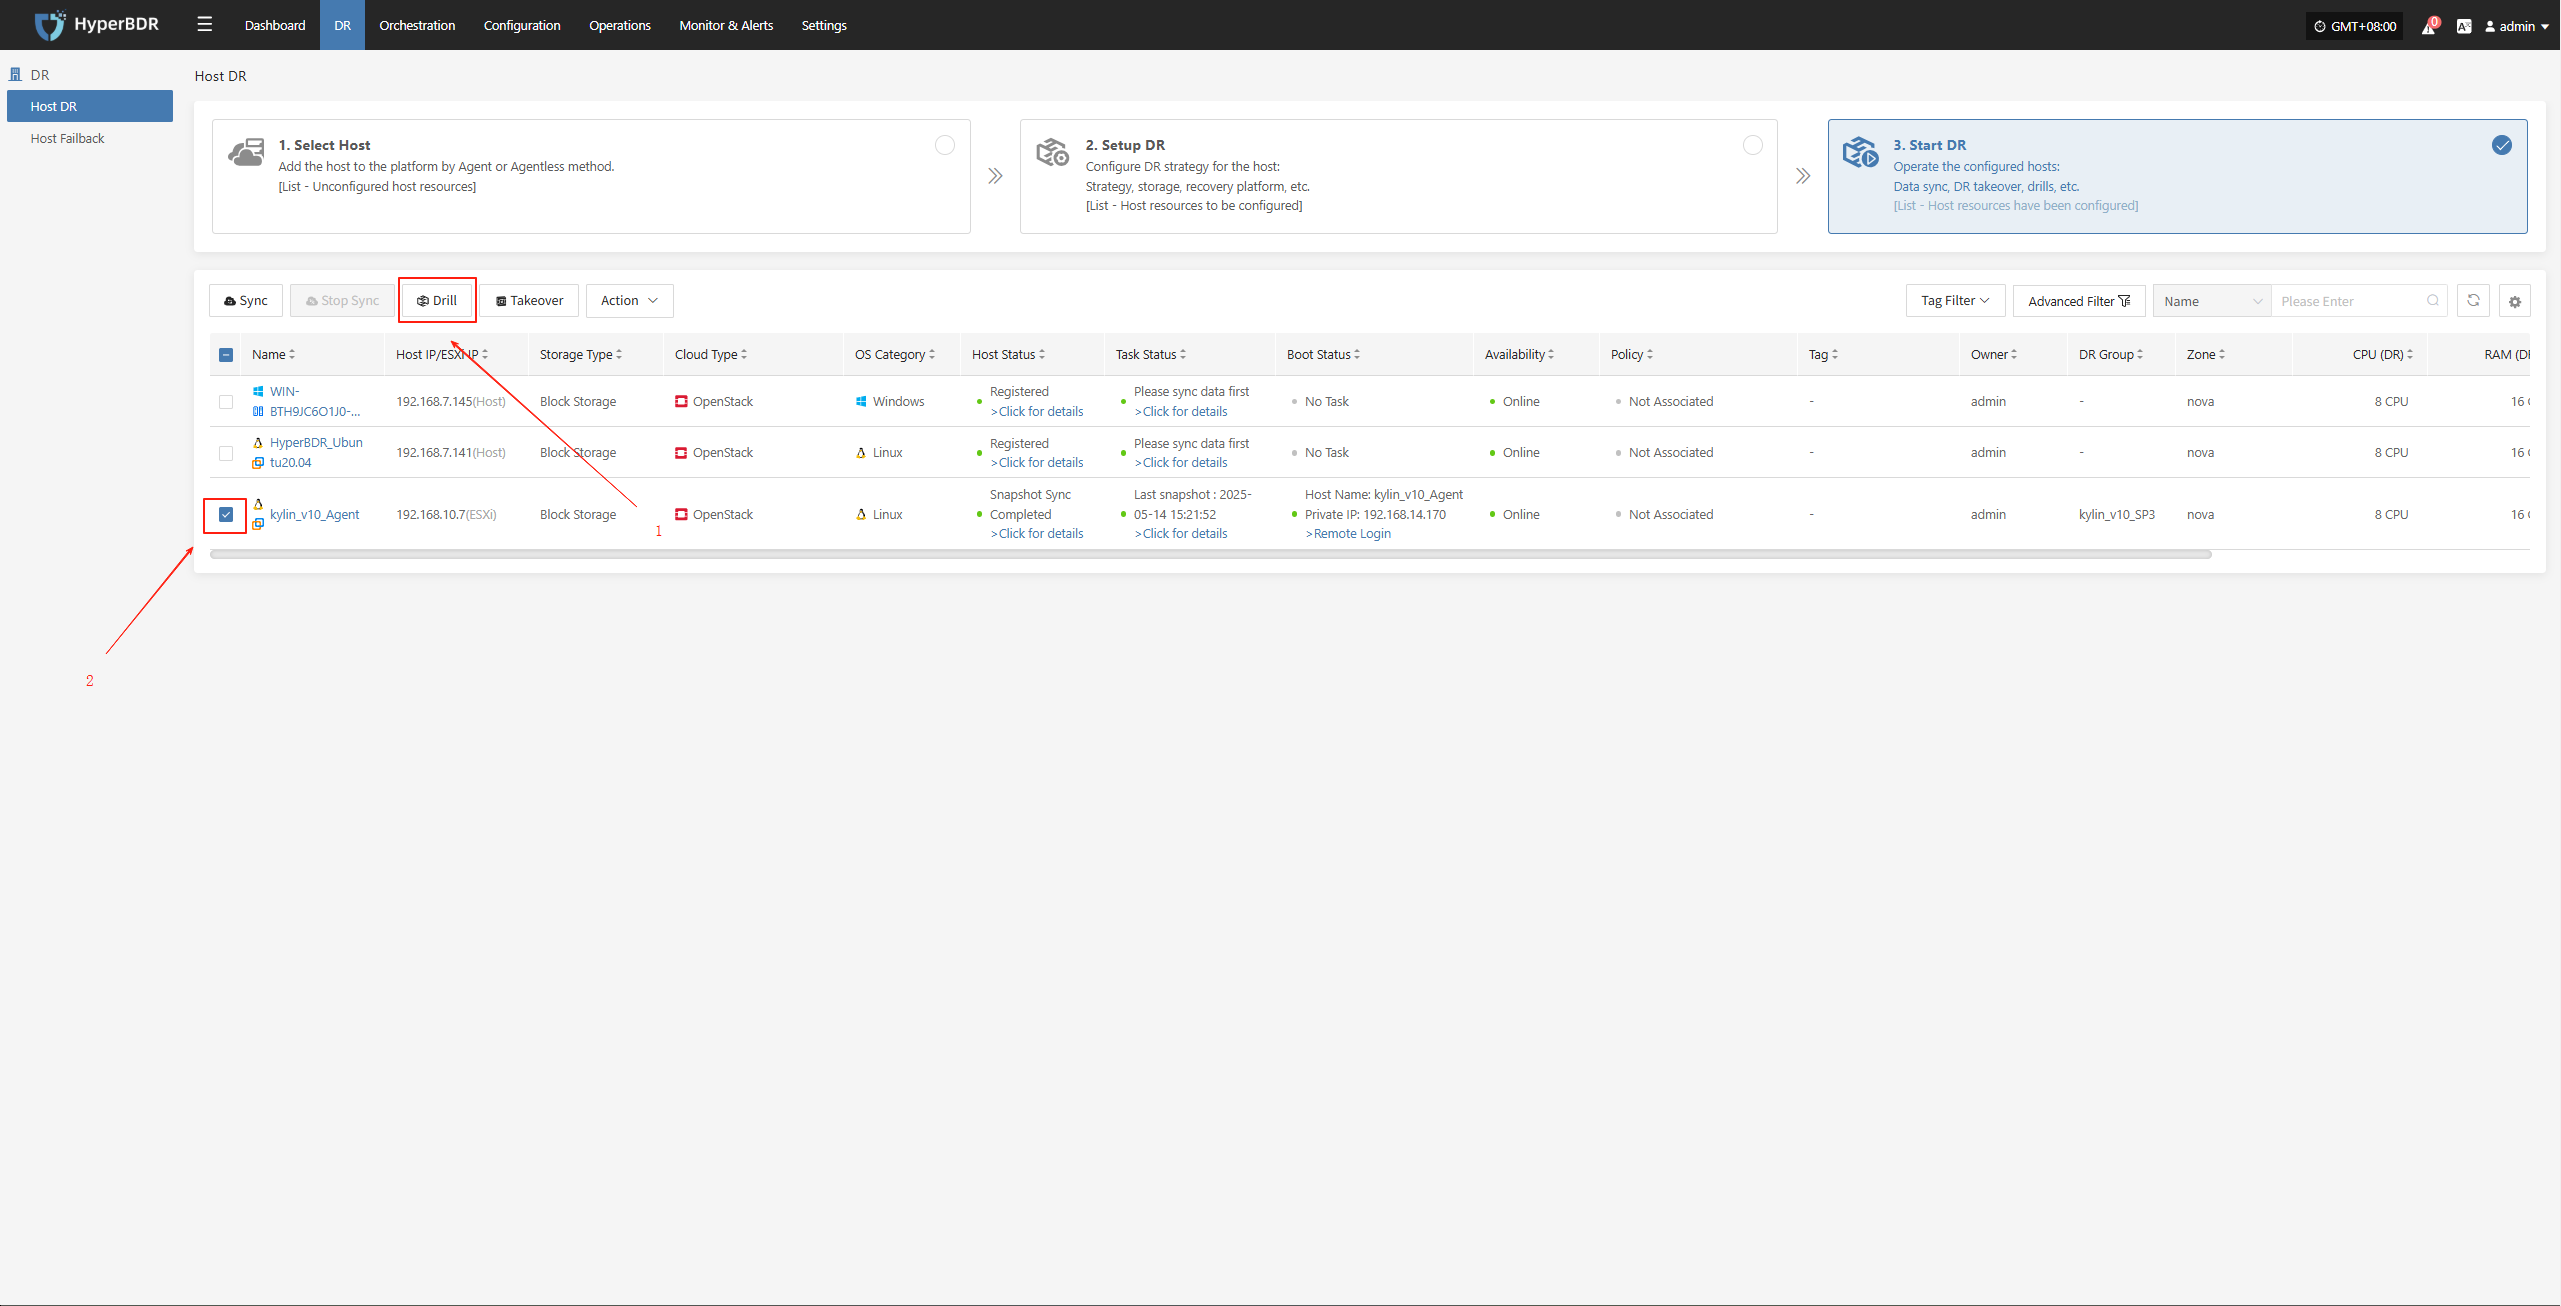
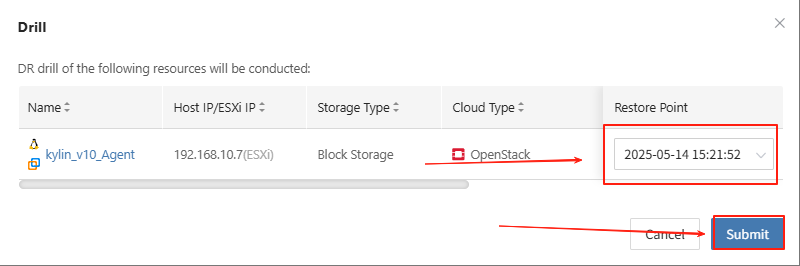
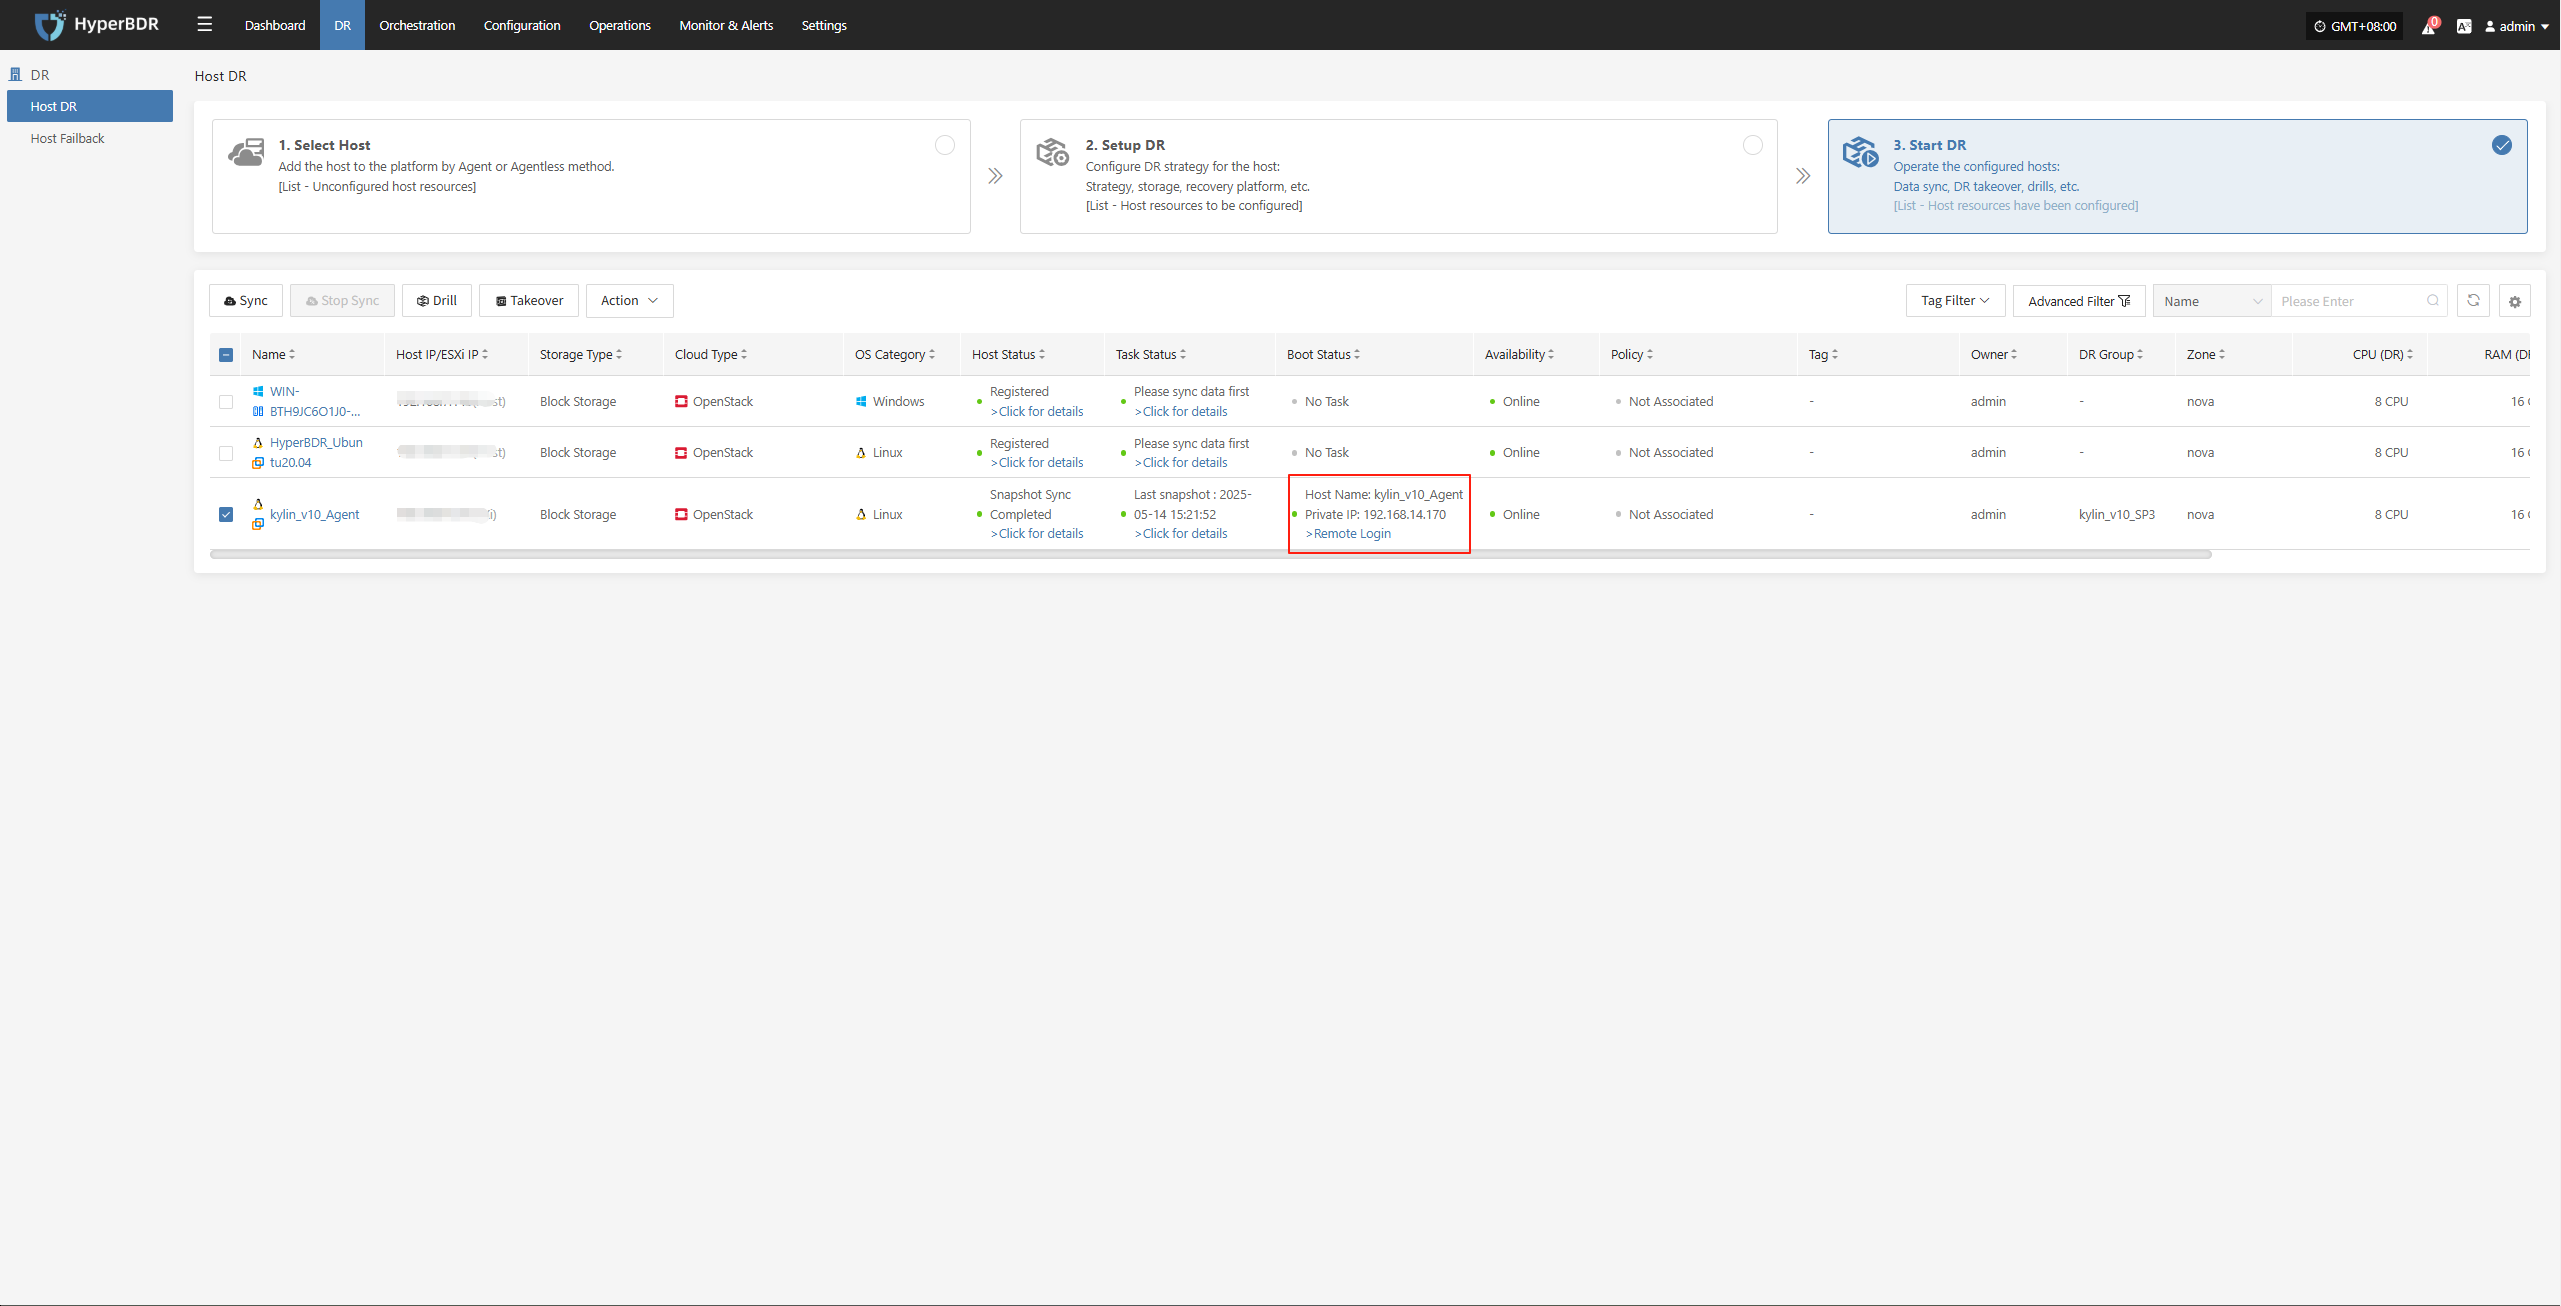
The system will automatically create or start the target instance based on the pre-configured resource orchestration (compute, storage, network, etc.). Once the startup is complete, you can log in to the target platform for verification and business drill.
Monitor the recovery progress to ensure that key business drills are completed within the expected RTO.
Business Verification
After recovery, check whether application services, databases, load balancers, etc. are functioning properly.
Perform data consistency checks to confirm that business functions are fully available.
Drill Verification and Report
Evaluation of Drill Results
Compare the actual recovery time with the preset RTO/RPO to see if the targets are met.
Record and analyze any exceptions, failure points, and the time taken to resolve them during the drill.
Writing of the Drill Report
- The report should include drill objectives, execution steps, result analysis, identified issues, and improvement measures.
You can use the platform's "Operations -- Report" feature to select the host involved in this drill and export a detailed disaster recovery drill report.
- Distribute the report to relevant teams (business, management, audit) to ensure closed-loop management.
Subsequent Optimization
Based on issues found during the drill, adjust backup strategies, resource allocation, or failure handling processes.
Update documentation and automation scripts to improve efficiency for future drills and real disaster recovery scenarios.
DR Takeover
Takeover Prerequisites
When a severe failure or disaster occurs on the source side and cannot be quickly restored, failover in the disaster recovery environment is required to ensure business continuity.
Confirm the Fault Level
If the fault cannot be repaired in a short time and has exceeded the acceptable RTO/RPO limits, disaster recovery takeover can be initiated.
It is necessary to confirm in advance that the production environment truly cannot be quickly restored, to avoid blind takeover that could cause greater impact.
DR Environment Preparation
Ensure that the target environment has completed the latest data synchronization or snapshot backup according to the HyperBDR policy.
The network configuration and resource quotas (such as CPU, memory, bandwidth, etc.) of the disaster recovery environment must meet the requirements for business launch.
Business Impact Assessment
Communicate with business stakeholders to understand the impact of the switchover on user access paths, data consistency, and application dependencies.
Confirm the takeover operation window and whether an external announcement is needed (such as notifying customers about the switchover).
Takeover Process
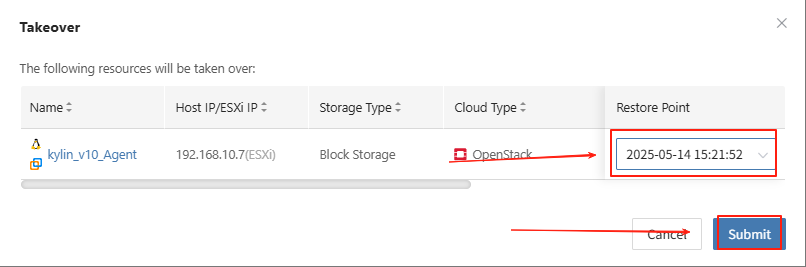
Perform Takeover
- In the HyperBDR console, select the "Takeover" function for the corresponding business host, choose the desired recovery snapshot point, and click Confirm.
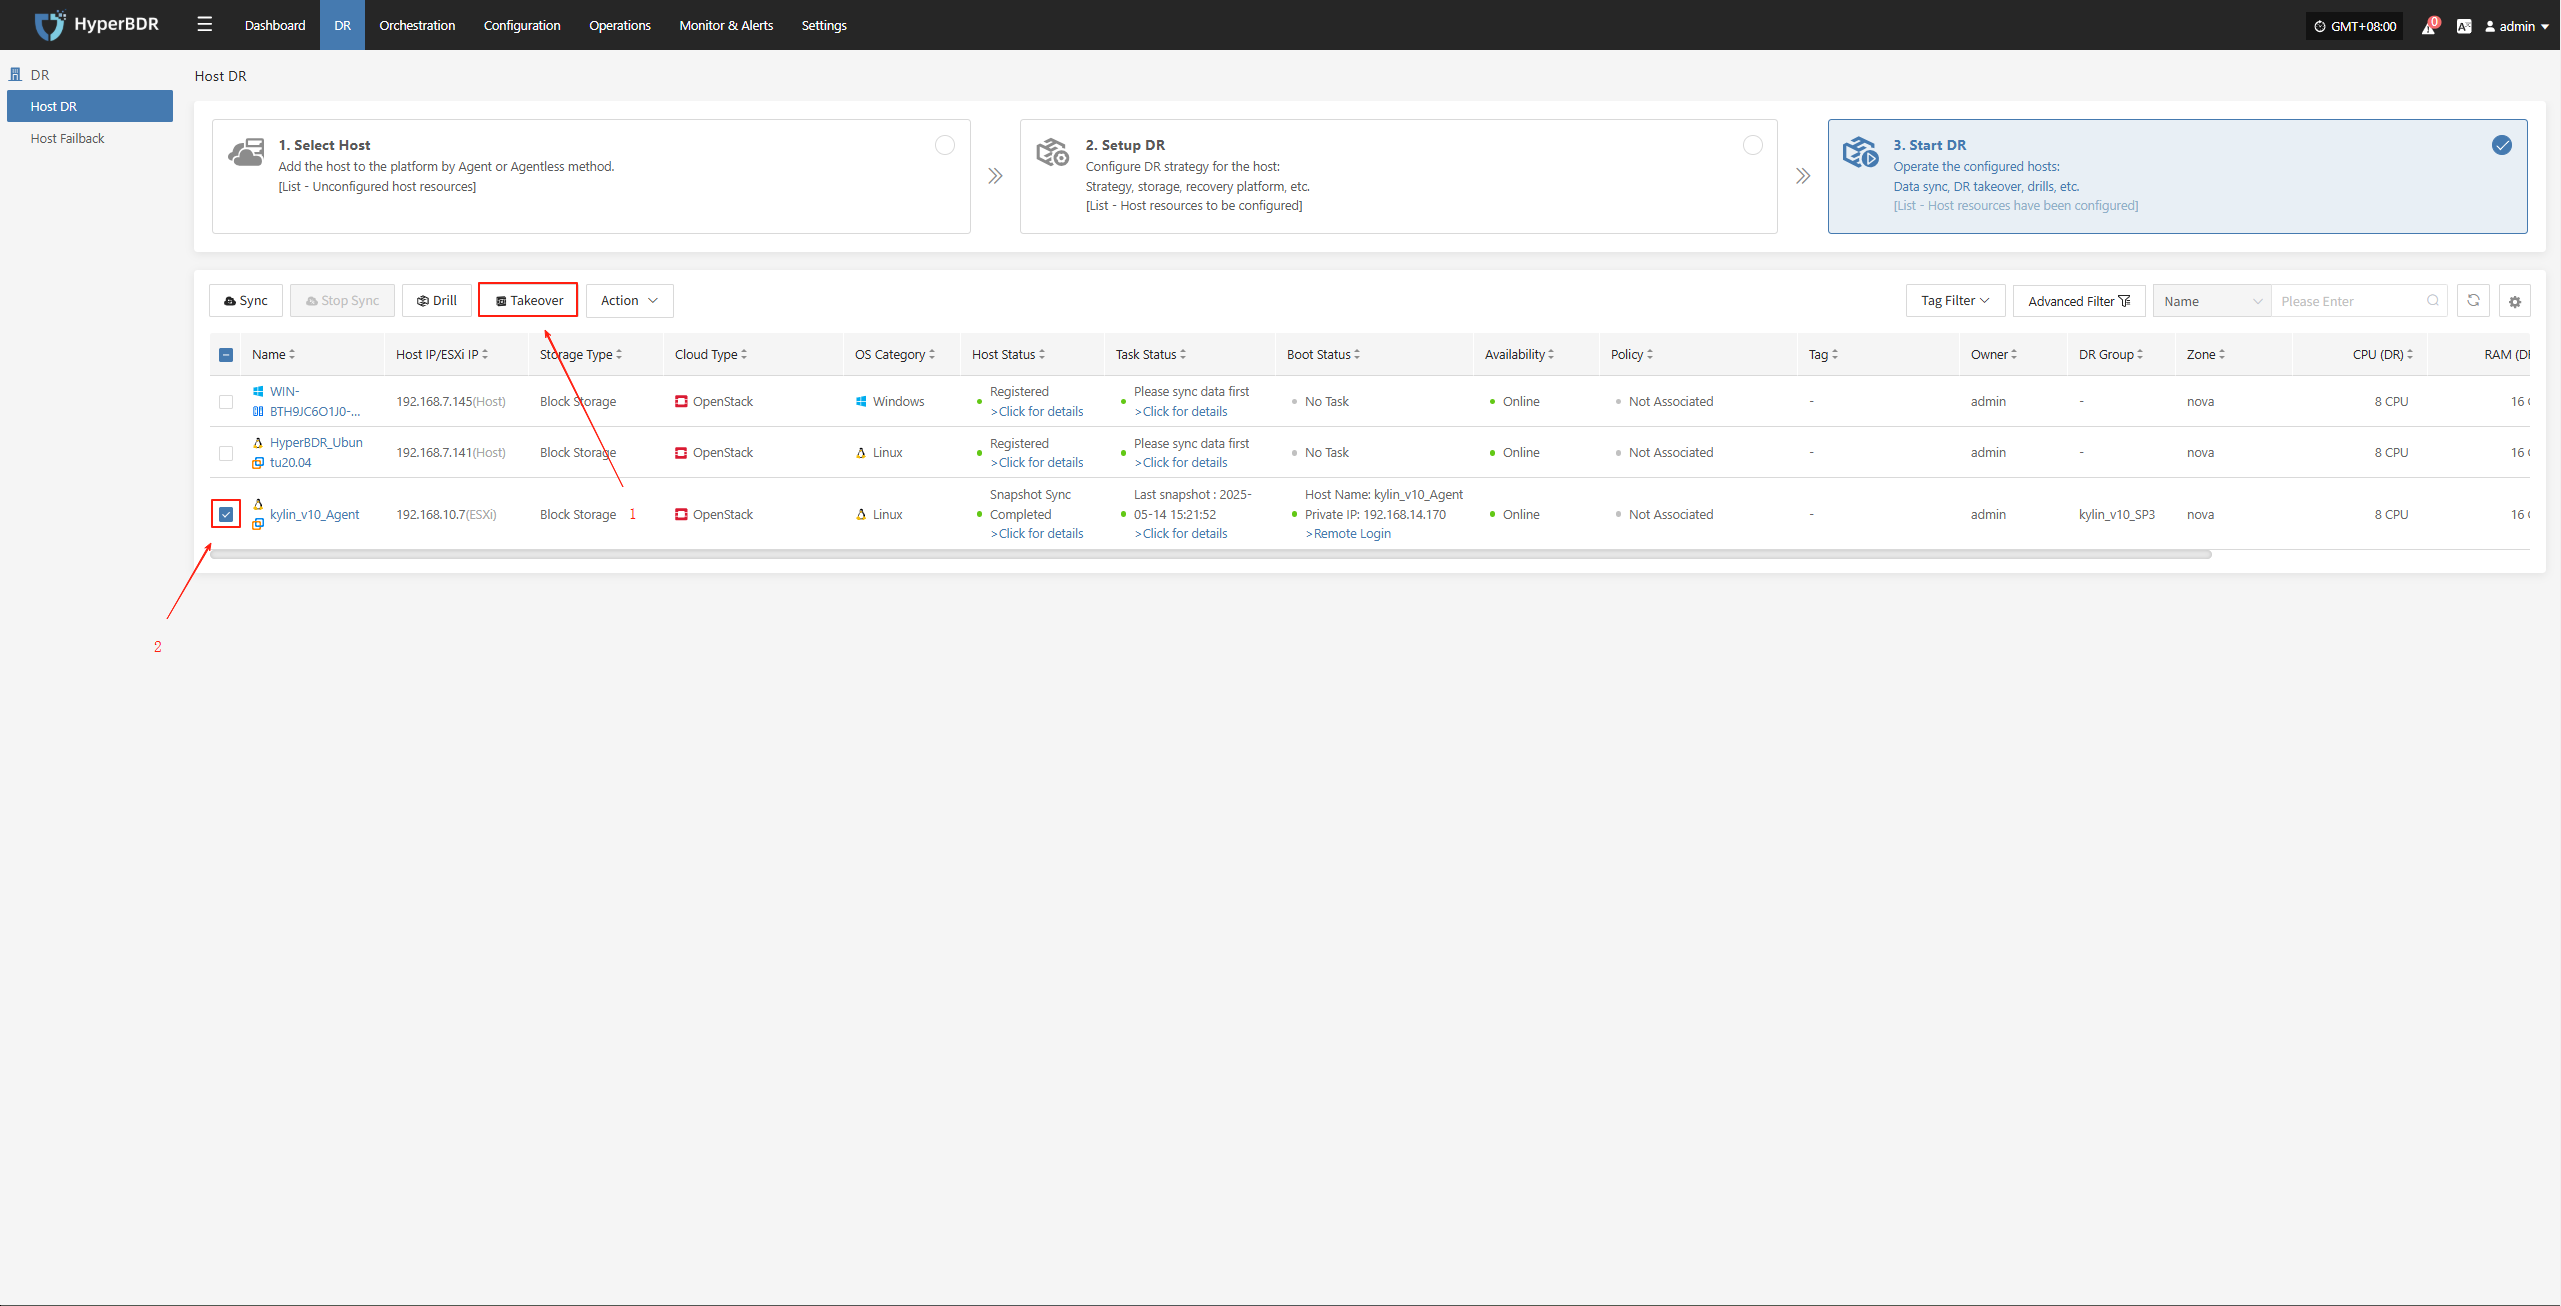
The system will automatically create or start the target instance based on the pre-configured resource orchestration (compute, storage, network, etc.). Once the startup is complete, you can log in to the target platform for verification, configuration, and business takeover.

Data Verification
After the business is started, check whether the database version, application service configuration, and dependent services (such as cache, message queue) are functioning properly.
If needed, perform partial traffic testing in the DR environment first. After confirming business functionality, proceed with a full switchover.
DNS/Load Balancing Switch
Modify DNS resolution or load balancing policies to direct user traffic to the DR environment.
Monitor traffic changes to ensure normal business access after the takeover.
Fault Takeover Switch Completed
Record the completion time of the takeover and continuously monitor system metrics on the dashboard.
Communicate with business stakeholders to verify that functionality and performance meet expectations.
Export the Business Takeover Report
You can use the platform's "Operations -- Report" feature to select the host involved in this takeover and export a detailed disaster recovery takeover report.


Archive and further analyze the exported business takeover report to identify any steps or processes that can be optimized.
Appendix
Commands and Tools
HyperBDR
View Service Logs
Service log directory:
/opt/installer/production/logs/- Check Service Component Status
docker ps # View the status of each service moduleNetwork Troubleshooting: Common commands include
ping,traceroute,telnet,curl, etc.
Question and Submission
During the daily operation and maintenance process, if you encounter relevant problems, you can visit the following QA website to query solutions related to the problems. If you encounter problems, you can also log in to the QA website to submit the problems you encountered. We will analyze the problems and respond quickly as soon as the problems are submitted.
Version Change Records
| Version | Date | Change Description | Author |
|---|---|---|---|
| 1 | 8/20/2024 | Initial version release | Disaster Recovery Product Operations Team |
| 2 | 12/10/2024 | Update alarm configuration | Disaster Recovery Product Operations Team |
| 3 | 2/10/2025 | Add disaster recovery drill/takeover operation | Disaster Recovery Product Operations Team |
| 4 | 2/15/2025 | Add log export functionality | Disaster Recovery Product Operations Team |
| 5 | 2/25/2025 | Add common issue explanations | Disaster Recovery Product Operations Team |
End Summary
Doucment Summary
This operations manual focuses on key aspects of using HyperBDR in a production environment, including daily operations, monitoring dashboards, disaster recovery drills, and failover handling. It provides structured procedures and best practices to support effective system management. The operations team should regularly review and update this manual based on real-world conditions to ensure the continued stability of the HyperBDR system and its ability to meet business requirements for disaster recovery and high availability.