Console Operations Maintenance
Console Operations Maintenance
Runtime Environment
The Console is installed on a Linux host (e.g., Ubuntu 20.04). All console services run inside containers, with databases and middleware including MariaDB, Redis, RabbitMQ, and InfluxDB.
The system is installed under /opt/installer. The main files and directory structure are:
/opt/installer
├── HyperBDR_release_v6.4.0_20250430-20250430-1079.tar.gz.version  # Installation package version info
├── Version                                                        # Overall system version info
├── production/                                                   # Core directory for console operation
│   ├── config/                         # Service configuration files (e.g., MariaDB, Redis, Proxy)
│   ├── data/                           # Middleware persistent data (MySQL, Redis, RabbitMQ, InfluxDB)
│   ├── databackup/                     # Backup directory for MySQL, Redis, and configuration files
│   ├── docker-compose-hyperbdr.yml     # HyperBDR container orchestration config
│   ├── docker-compose-hypermotion.yml  # HyperMotion container orchestration config
│   ├── entrypoint.sh                   # System initialization and startup script
│   ├── init/
│   │   └── 01.sql                      # Database initialization SQL script
│   ├── logs/                           # Service logs (for troubleshooting)
│   ├── openssl.cnf                     # OpenSSL configuration (e.g., certificate generation)
│   ├── scripts/                        # Shell scripts for installation, upgrade, uninstall, backup, etc.
│   ├── softwares/                      # Bundled third-party tools (e.g., curl, ossutil, ttyd)
│   ├── ttyd                            # ttyd executable (web terminal service)
│   ├── venvs/                         # Python virtual environments for each service
│   └── version                        # Current deployment version info
The
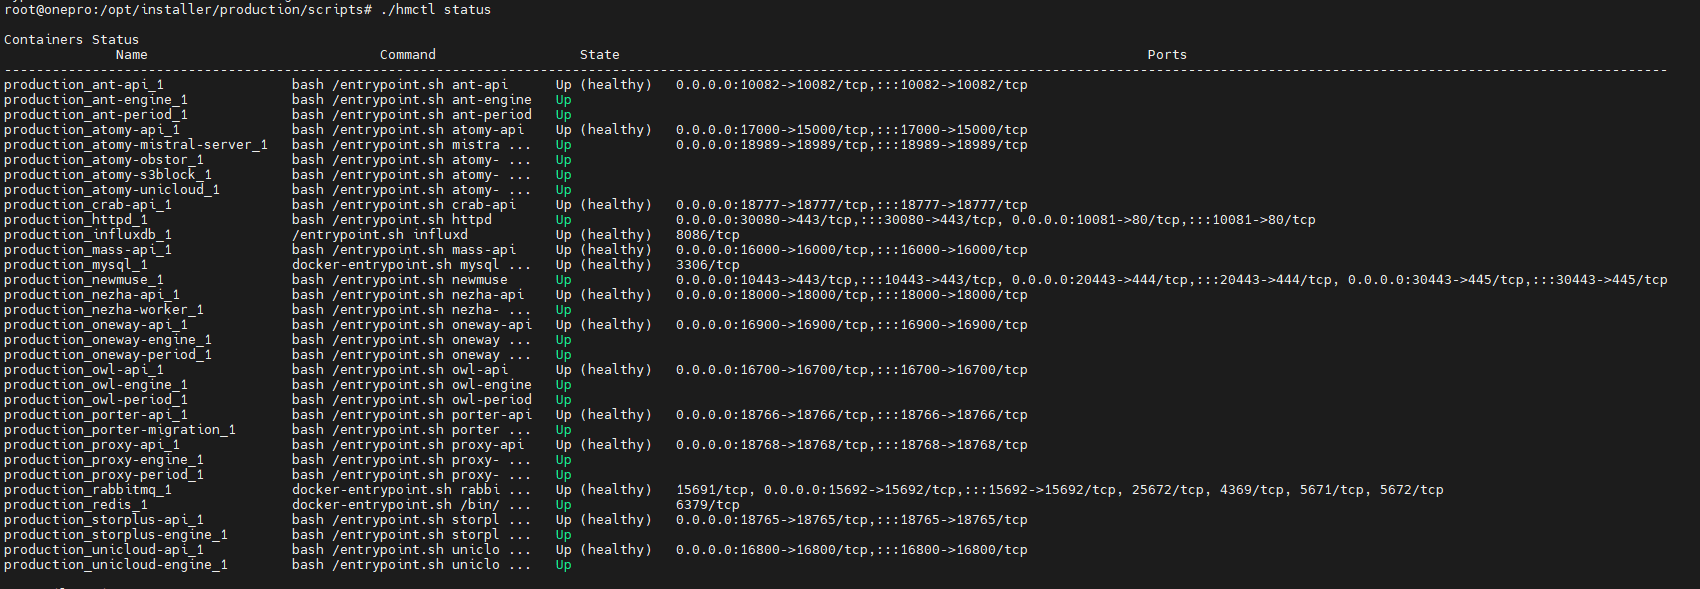
Statecolumn indicates service health status:Up: Service is running normallyUp (healthy): Container is running and health check passedExit/Restarting: Service is abnormal or failed to start
- Log disk usage

- Program disk usage

- Remaining disk space

- Health of service port 10443

Service Health Status
All services run as Docker containers. O&M staff can check the service status using the hmctl command.
Example:
/opt/installer/production/scripts/hmctl statusTip: Add the scripts directory to your PATH for global access:
echo 'export PATH=$PATH:/opt/installer/production/scripts' >> ~/.bashrc
source ~/.bashrc
The
Statecolumn indicates service health status:Up: Service is running normallyUp (healthy): Container is running and health check passedExit/Restarting: Service is abnormal or failed to start
- Log disk usage
- Program disk usage
- Remaining disk space
- Health of service port 10443
Service Start/Stop/Restart
O&M staff can start, stop, or restart services using the hmctl command.
Note: If the command is in your PATH, simply run:
hmctl <command>
Start all services
/opt/installer/production/scripts/hmctl startStart a specific service
/opt/installer/production/scripts/hmctl start <service-name>Stop all services
/opt/installer/production/scripts/hmctl stopStop a specific service
/opt/installer/production/scripts/hmctl stop <service-name>Restart all services
/opt/installer/production/scripts/hmctl restartRestart a specific service
/opt/installer/production/scripts/hmctl restart <service-name>Reload services
Note: Use this command only after updating the base image.
/opt/installer/production/scripts/hmctl reload
Log Management
All system log files are located under /var/log/installer. O&M staff can monitor system status, troubleshoot issues, or provide logs to project managers as needed.
/var/log/installer/
├── autoinstall-user-data                  # Auto-install user data config
├── block                                  # Disk block data, usually partition info
├── casper-md5check.json                   # MD5 check for installation image
├── curtin-install-cfg.yaml                # Curtin installation tool config
├── curtin-install.log                     # Curtin installation log
├── installer-journal.txt                  # Key installation event logs
├── media-info                             # Installation media information
├── subiquity-client-debug.log -> subiquity-client-debug.log.2396
├── subiquity-client-debug.log.2396
├── subiquity-client-info.log -> subiquity-client-info.log.2396
├── subiquity-client-info.log.2396
├── subiquity-curtin-apt.conf
├── subiquity-curtin-install.conf
├── subiquity-server-debug.log -> subiquity-server-debug.log.2463
├── subiquity-server-debug.log.2463
├── subiquity-server-info.log -> subiquity-server-info.log.2463
└── subiquity-server-info.log.2463
Log Collection
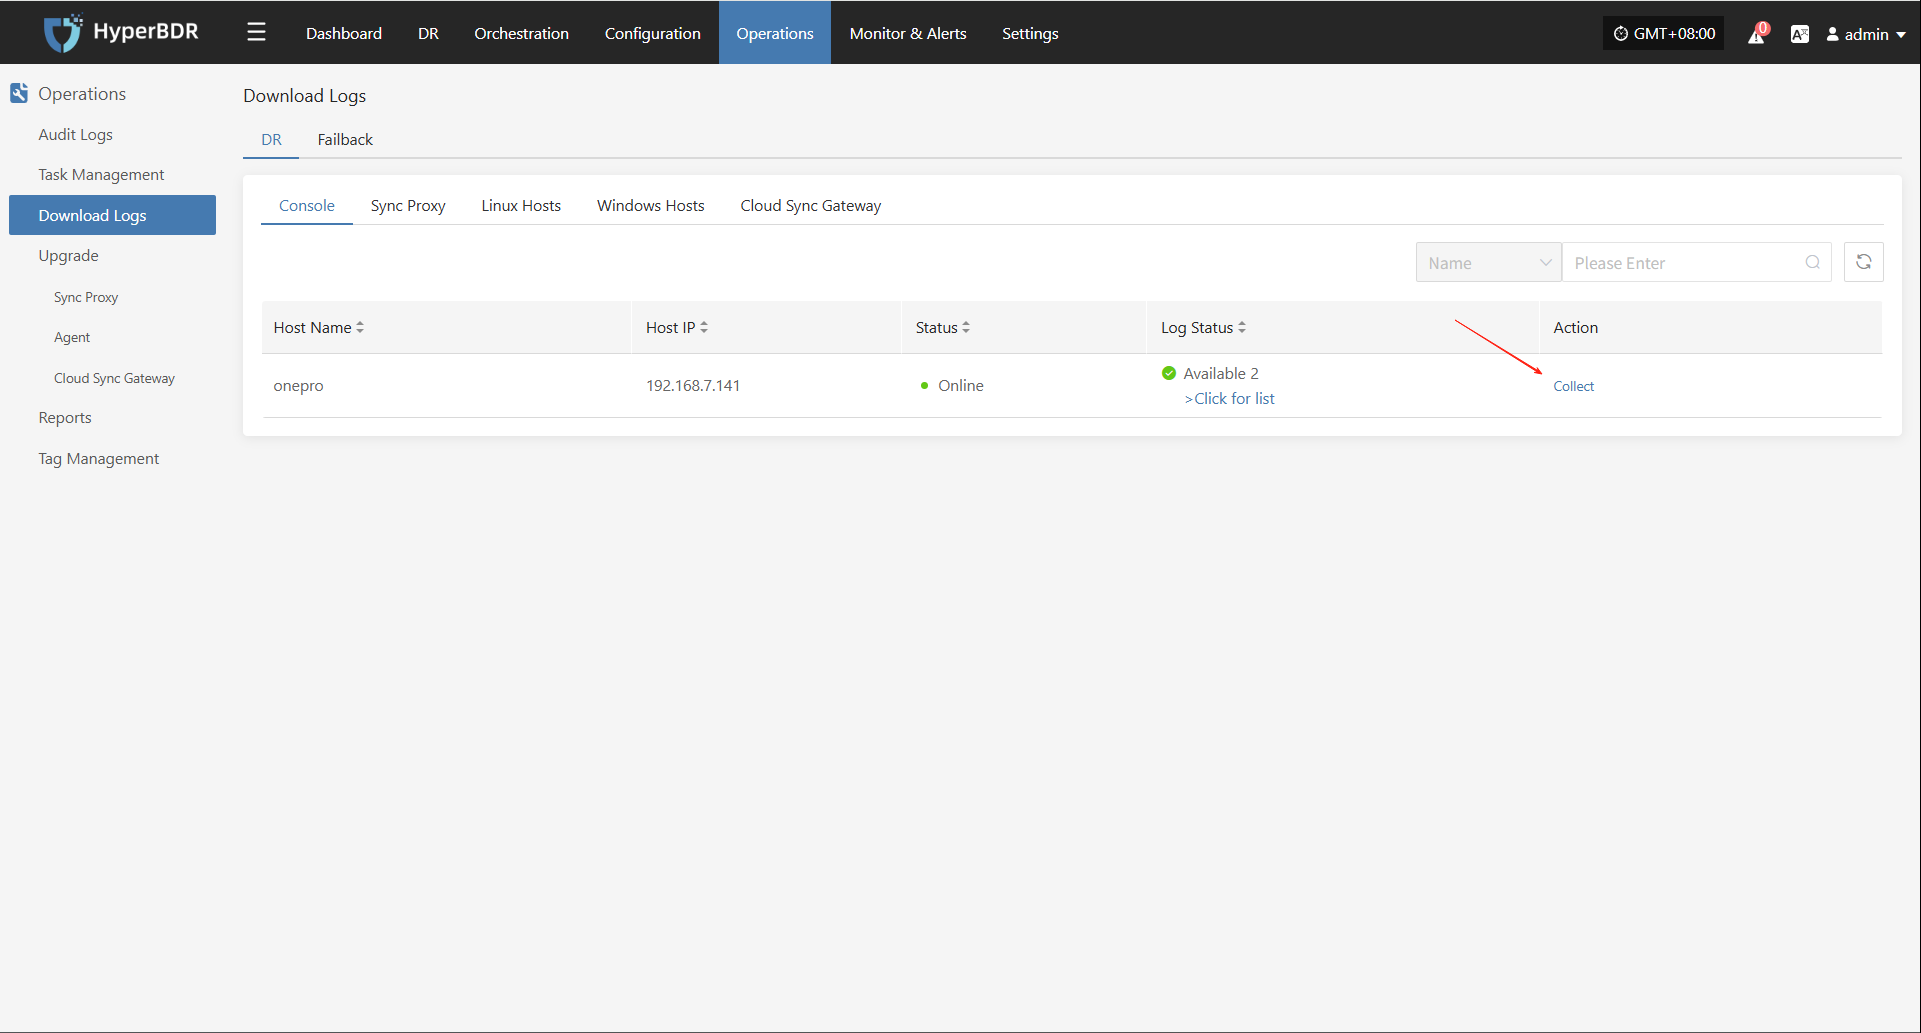
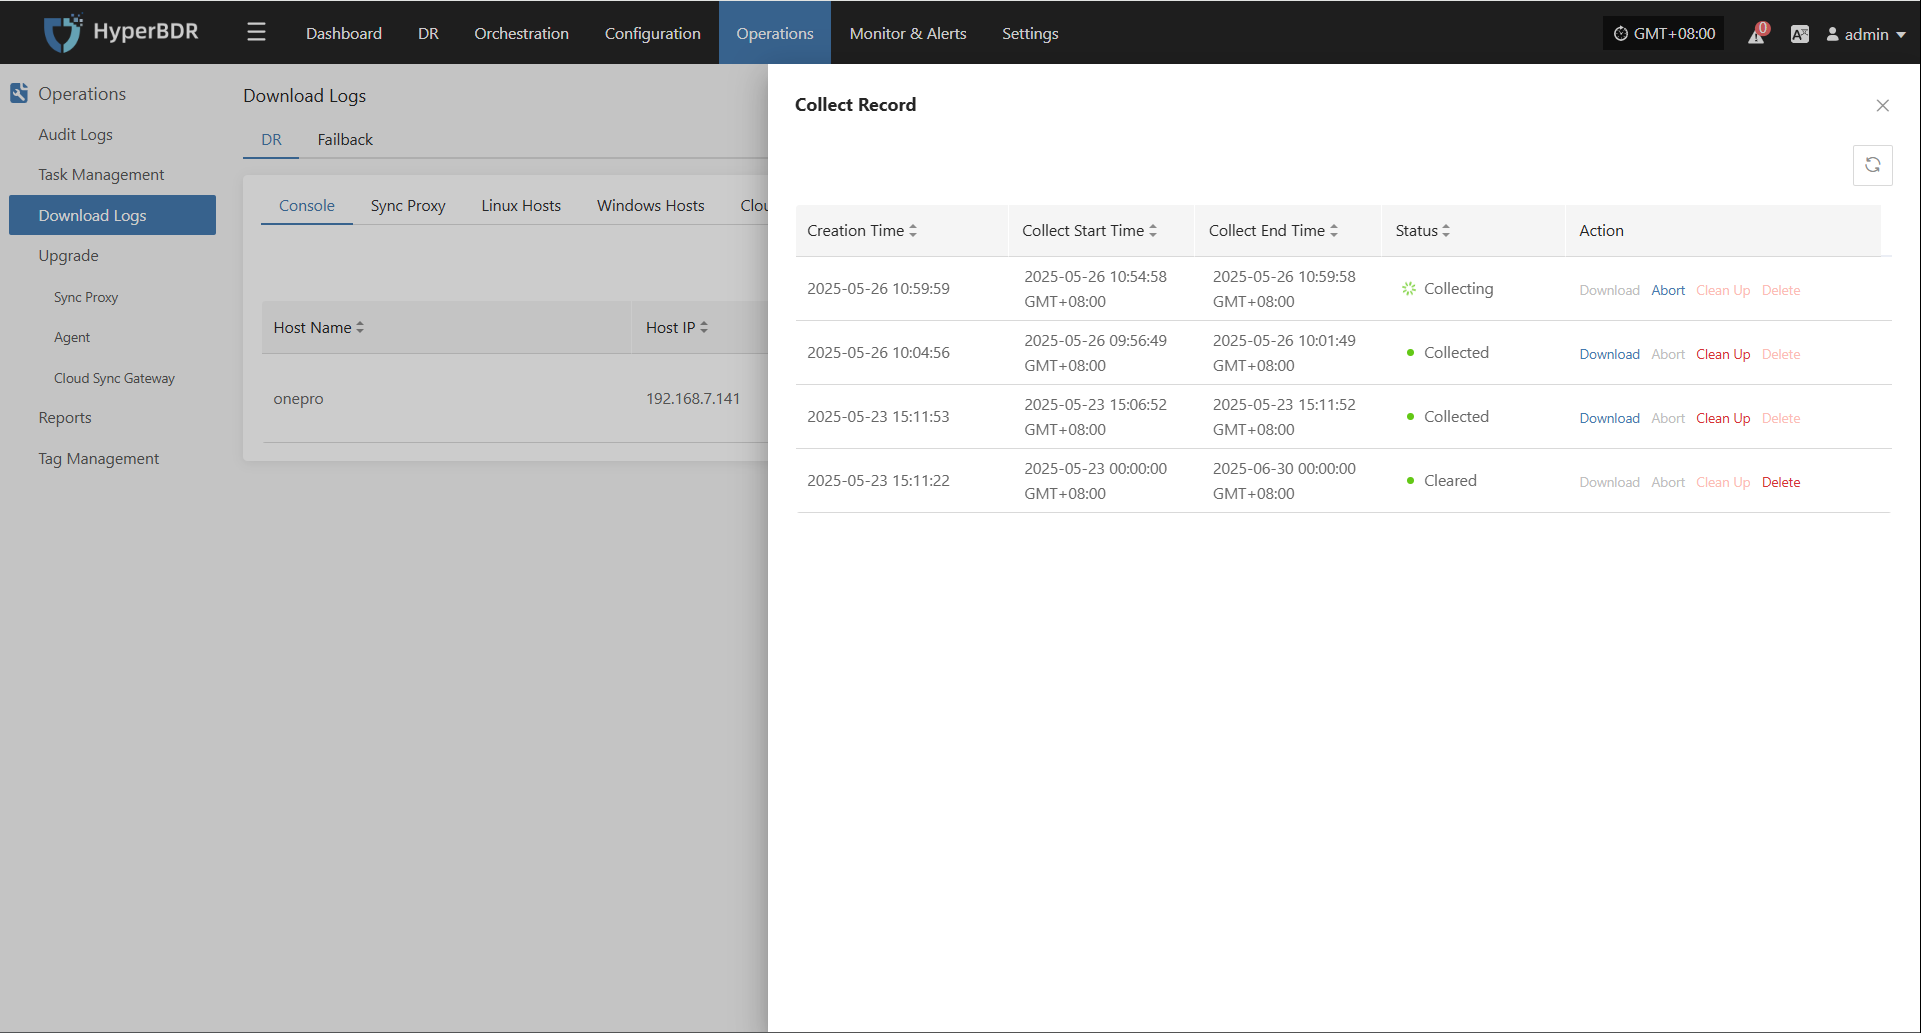
In the HyperBDR system, operations personnel can collect and download the required log files from the “Operations > Download Logs > DR | Failback > Console” page according to their needs, facilitating issue troubleshooting and system monitoring.
Select the target host and click the "Collect" button in the corresponding row.
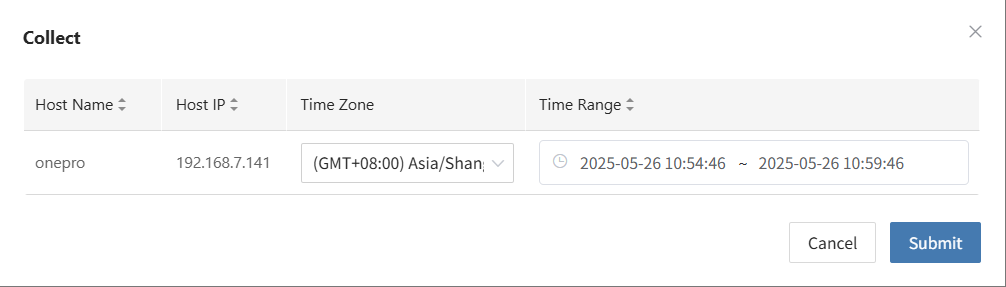
Select Time Range
In the pop-up dialog, set the time range for the logs you want to collect. After confirming, the system will automatically start collecting logs.
Start Collection
After confirming the time range, the system will automatically start collecting logs, and the log status will change to "Collecting".
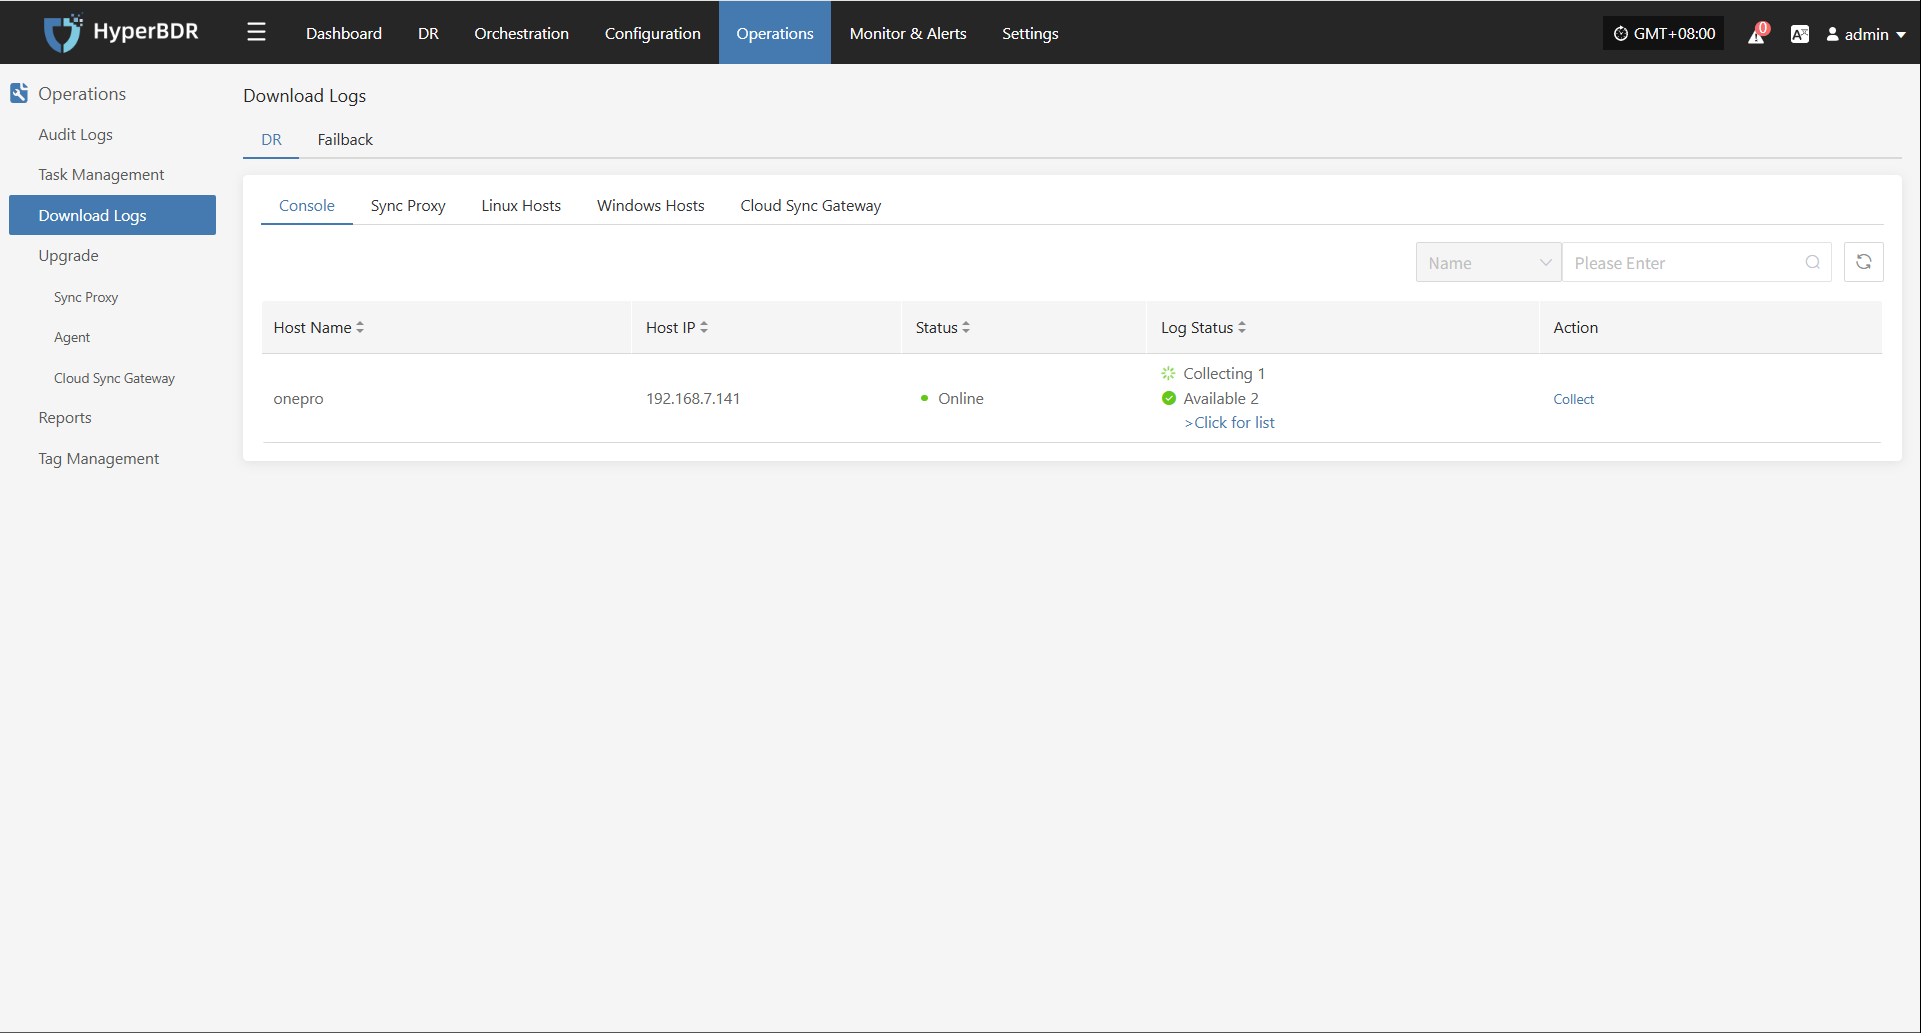
Download Logs
After log collection is complete, the status will update to "Available". Users can click "Click for list" to see the log files and select files to download.
Configuration File Management
All system configuration files are stored in /opt/installer/production/config. O&M staff can edit these files as necessary.
Due to the large number of configuration files, only an example for the
antservice is shown below:
[DEFAULT]
# Debug and logging options
debug = False
verbose = False
ant_api_listen = 0.0.0.0
ant_api_listen_port = 10082
transport_url = rabbit://guest:fs82BgKdU2QTr4Oy@rabbitmq:5672//

# Log rotation (commented out, enable if needed)
# log_rotation_type = size
# max_logfile_count = 10
# max_logfile_size_mb = 64

# API service settings
ant_api_workers = 1
proxy_base_url = http://proxy-api:18768
porter_base_url = http://porter-api:18766
porter_proxys_url = http://porter-api:18766/proxys
storplus_base_url = http://storplus-api:18765
OWL_BASE_URL = "http://owl-api:16700"

[database]
backend = sqlalchemy
connection = mysql://ant:antPass@mysql:3306/ant?charset=utf8
use_db_reconnect = True
max_pool_size = 30
max_overflow = 20
pool_timeout = 30
connection_recycle_time = 300

[period]
interval = 5
timeout = 86400